( ESNUG 523 Item 8 ) -------------------------------------------- [05/02/13]
Subject: Virtuoso R&D and LibTech still both doubt Solido's 6-sigma claims
> I hope that I have helped to illuminate what high-sigma analysis is about,
> explained what Solido HSMC does, addressed Mehmet's concerns, and shown
> how it relates to other high-sigma analysis techniques.
>
> - Trent McConaghy of Solido Design
> http://www.deepchip.com/items/0513-06.html
From: [ Hongzhou Liu of Cadence ]
Hi John,
Thanks for the discussions on circuit simulation-based high yield estimation
using foundry statistical device models. (ESNUG 505 #6, 512 #6, 513 #6)
I really appreciate Trent's explanation for what problem the current high
yield solution algorithms are trying to solve in ESNUG 513 #6.
However I want to clarify some of the claims in his comparison chart of
high-sigma estimation algorithms, especially the comparison he makes between
Solido High-Sigma MC and the "Worst Case Distance approach":
1. Worst Case Distance is a yield estimation metric which defines the
shortest distance from the spec boundary to the nominal point in
statistical space. It does not define what algorithm is used to
find the worst case distance point. It doesn't have the limitation
that the spec vs statistical variables must be linear or quadratic.
There are different algorithms to identify the worst case distance
point in statistical space which are not limited to linear sensitivity
or quadratic model. A good nonlinear optimization algorithm can
identify the worst case distance point in a very non-linear spec
boundary in statistical space.
2. The linearity/non-linearity mapping between statistical parameter
to performance does not imply how difficult it is to identify the
worst case distance point. The non-linear mapping and non-Gaussian
distribution may have a very linear spec contour plot in the
statistical space, which helps to find worst case distance point
very easily.
For example, when we try to explore the vth variation for SRAM cell,
we find that bit voltage has big drop-offs in the performance vs
statistical variables mesh plot. It indicates a very nonlinear
relationship between performance and statistical variables.
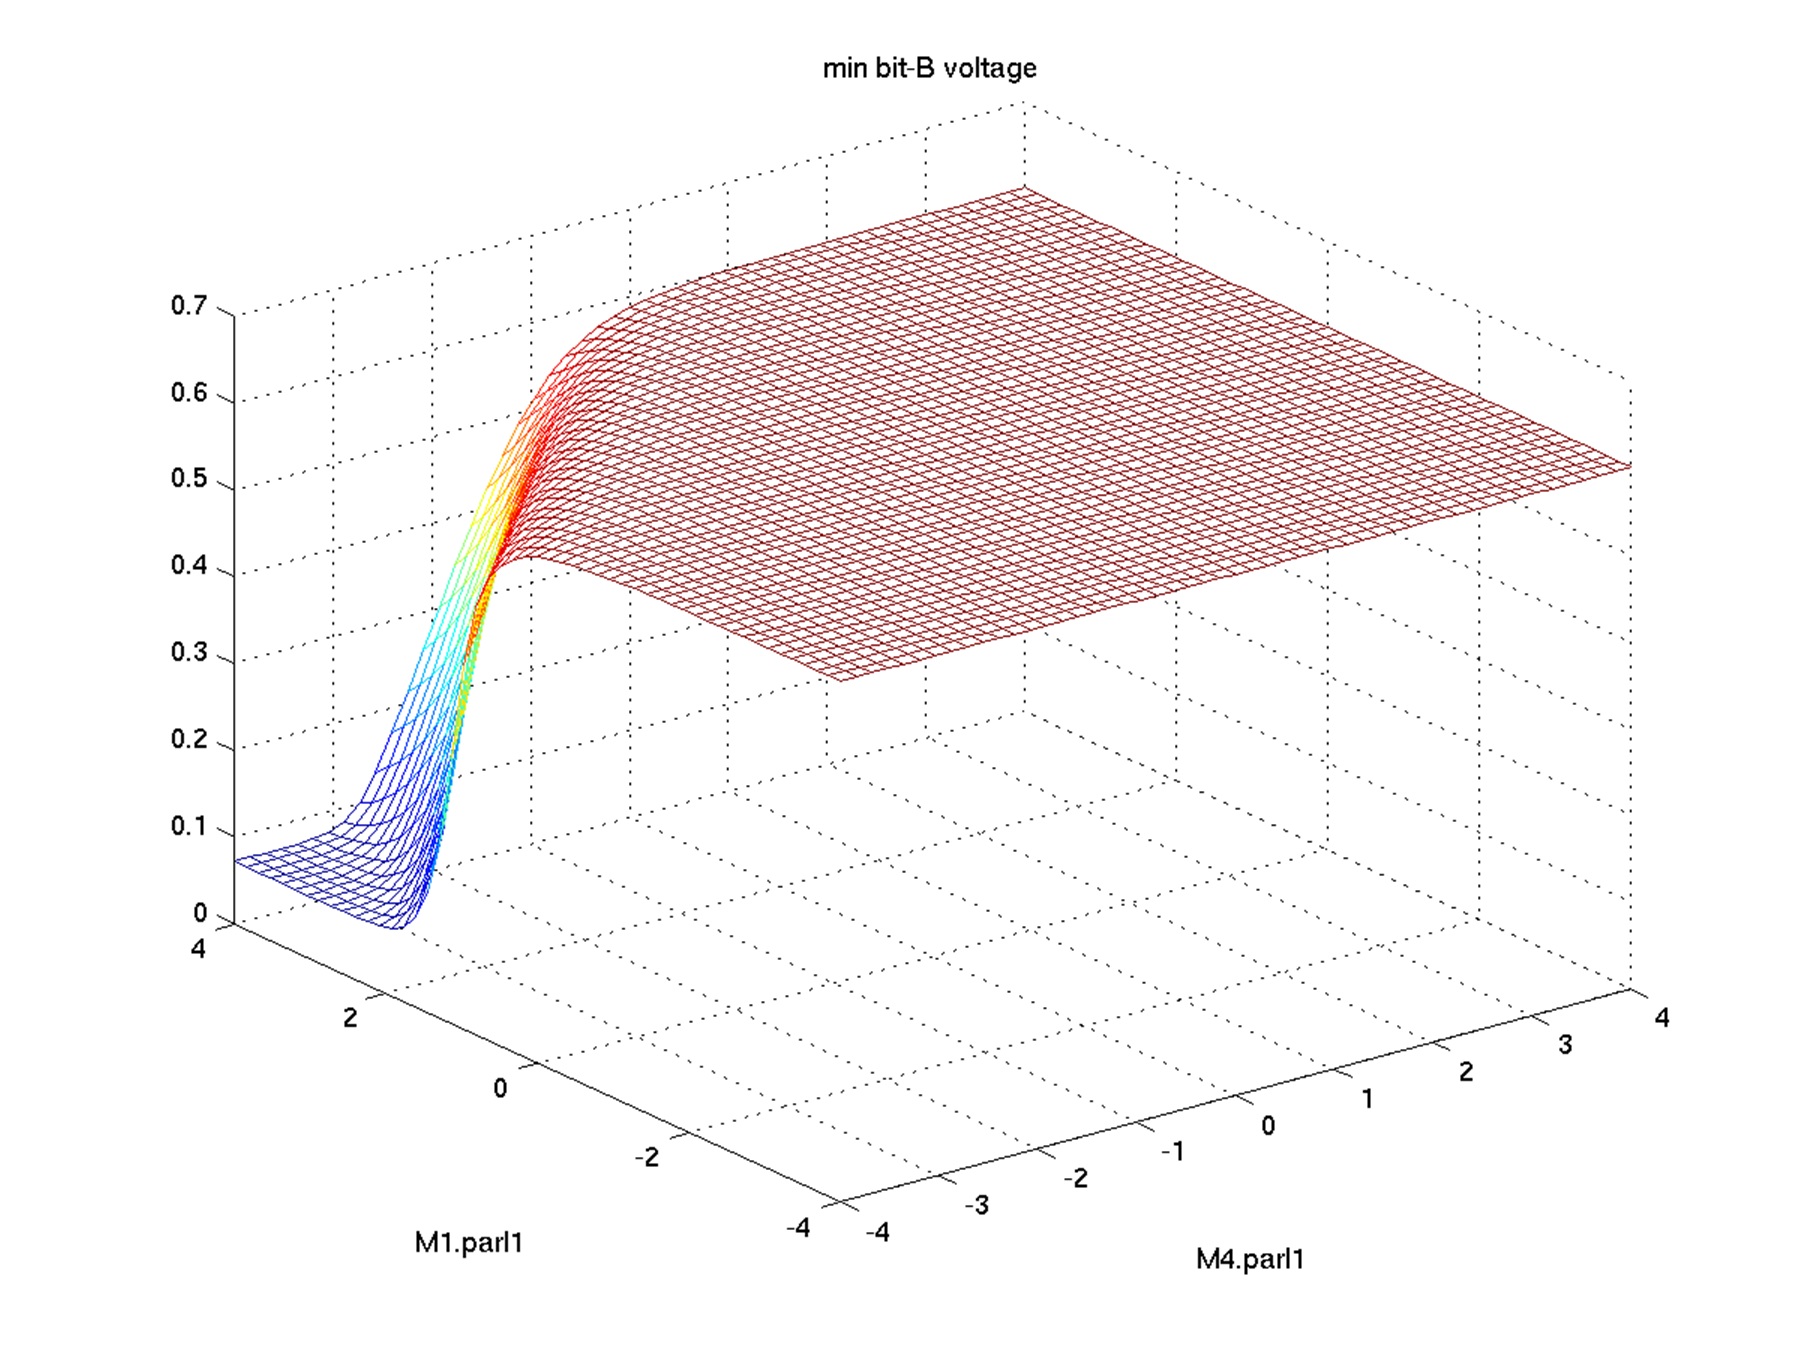 Fig 1. Bit voltage vs statistical variables plot
The X,Y axes of Figure 1 are the Vth mismatch variation of the
important MOS transistors. The Z axis shows the mesh plot of
the read current of SRAM cell.
However, if we plot the performance spec contour line plot, it
indicates how easy or difficult it is to find the Worst Case
Distance points.
Fig 1. Bit voltage vs statistical variables plot
The X,Y axes of Figure 1 are the Vth mismatch variation of the
important MOS transistors. The Z axis shows the mesh plot of
the read current of SRAM cell.
However, if we plot the performance spec contour line plot, it
indicates how easy or difficult it is to find the Worst Case
Distance points.
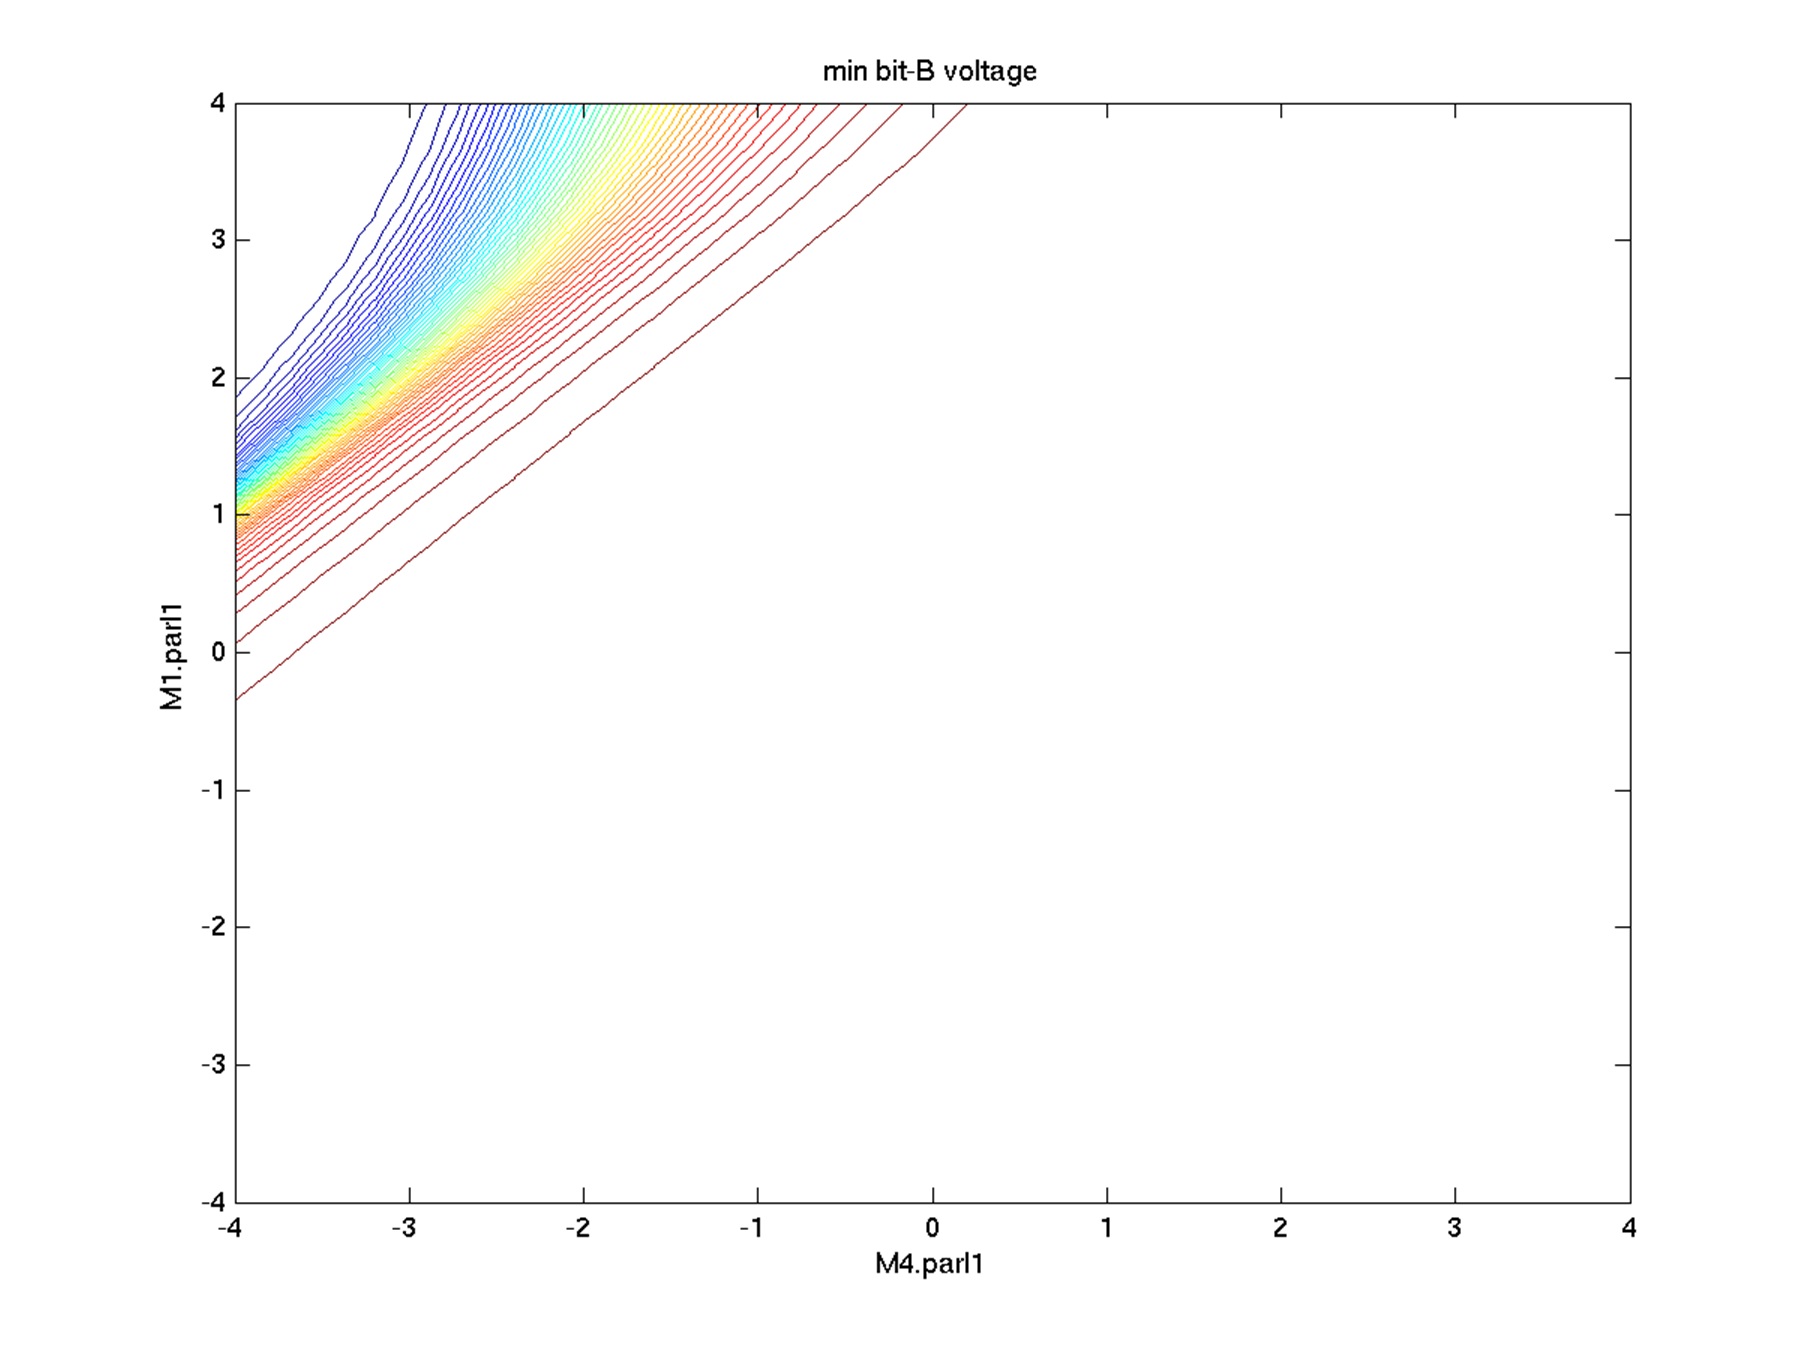 Fig 2. Bit voltage contour line plot in statistical space
In Figure 2, each curve line presents the same constant value of read
current. We will find that there is little challenge in finding the
worst case distance point in this "non-linear" behavior circuit.
3. There are some recent research papers that talk about applying data
-mining techniques to screen important statistical variables.
a. Wangyang Zhang, Xin Li and Rob Rutenbar, "Bayesian virtual
probe: minimizing variation characterization cost for
nanoscale IC technologies via Bayesian inference," IEEE/ACM
Design Automation Conference (DAC), pp. 262-267, 2010.
b. Xin Li and Hongzhou Liu, "Statistical regression for efficient
high-dimensional modeling of analog and mixed-signal performance
variations," IEEE/ACM DAC, pp. 38-43, 2008.
If Solido High Sigma estimation can "Data-mine the relation from *input*
process variables to *output*, similar algorithms can be applied to pre-
processing the data before searching for the real worst case distance point.
Actually that is what Cadence Virtuoso ADE GXL offers.
The following are my comments on the chart in ESNUG 513 #6 comparing between
Solido High-Sigma MC and "Worst Case Distance"-based approach by Trent.
Trent's Approaches to High-Sigma Estimation (MC = Monte Carlo)
Fig 2. Bit voltage contour line plot in statistical space
In Figure 2, each curve line presents the same constant value of read
current. We will find that there is little challenge in finding the
worst case distance point in this "non-linear" behavior circuit.
3. There are some recent research papers that talk about applying data
-mining techniques to screen important statistical variables.
a. Wangyang Zhang, Xin Li and Rob Rutenbar, "Bayesian virtual
probe: minimizing variation characterization cost for
nanoscale IC technologies via Bayesian inference," IEEE/ACM
Design Automation Conference (DAC), pp. 262-267, 2010.
b. Xin Li and Hongzhou Liu, "Statistical regression for efficient
high-dimensional modeling of analog and mixed-signal performance
variations," IEEE/ACM DAC, pp. 38-43, 2008.
If Solido High Sigma estimation can "Data-mine the relation from *input*
process variables to *output*, similar algorithms can be applied to pre-
processing the data before searching for the real worst case distance point.
Actually that is what Cadence Virtuoso ADE GXL offers.
The following are my comments on the chart in ESNUG 513 #6 comparing between
Solido High-Sigma MC and "Worst Case Distance"-based approach by Trent.
Trent's Approaches to High-Sigma Estimation (MC = Monte Carlo)
|
Standard MC |
Solido High-Sigma MC |
Importance Sampling |
Extrapolation |
Worse Case Distance |
| Simulation Reduction Factor |
1 X |
1 Million X |
1 Million X |
1 Million X |
1 Million X if linear. Worse if quadratic. |
| Accuracy |
YES.
Draws samples from actual distr. until enough tail samples. |
YES.
Draws samples from actual distr., simulates tail samples. |
NO.
Distorts away from the actual distr. towards tails. |
NO.
From MC samples, extrapolates to tails. |
NO.
Assumes linear or quadratic, Assumes 1 failure region. |
| Scalability |
YES.
Unlimited process variables |
YES.
1000+ process variables |
NO.
10-20 process variables |
YES.
Unlimited process variables |
OK / NO.
# process variables = # simulations - 1 (if linear). Worse if quadratic. |
| Verifiability |
YES.
Simple, transparent behavior |
YES.
Transparent convergence (akin to SPICE KCL/KVL) |
NO.
Cannot tell when inaccurate |
NO.
Cannot tell when inaccurate |
NO.
Cannot tell when inaccurate |
ACCURACY
For the "Worst Case Distance"-based approach there is no linear or quadratic
assumption in identifying the worst case distance point. It depends on the
actual algorithm it is using. The accuracy will be very high for high-sigma
estimation. I include the results comparison between 30 million Monte Caro
runs and 300 simulations from a Virtuoso ADE GXL Worst Case Distance run
using 28 nm statistical model. The measured result is read current from
a 6-cell SRAM.
Yield (sigma) 3.0 3.5 4.0 4.5 5.0 5.5
30 million MC results 2.378 2.139 1.912 1.695 1.520 1.371
WCD Run (300 sims) 2.423 2.177 1.948 1.736 1.539 1.359
The circuit may have multiple failure modes in statistical space. However,
they can be captured using different Worst Case Distance measurements.
For Solido High-Sigma MC, the error comes from two parts:
1. The modeling error comes from "Data-mines the relation from
*input* process variables to *output*". High-dimensional
non-linear data mining modeling is very challenging especially
to get high accuracy.
2. The yield estimation is limited to 5 billion samples which are
generated up front to predict 6-sigma yield.
Another advantage of Worst Case Distance-based approach is that it is not
limited to 6-sigma yield. It can explore further in the statistical space
to find actual values to cause circuit or specification failure.
SCALABILITY
"Worst Case Distance"-based approach: can use data-mining to pre-process the
statistical variables. Brute force worst case distance algorithm is not
recommended.
Solido High-Sigma MC: The efficiency of high-dimensional data mining impacts
both Solido High-Sigma MC and the pre-processing of WCD-based approach.
VERIFIABILITY
WCD-based approach: the worst case distance point is simulated and verified
to make sure it is a worst case distance point in statistical space. It
can be used to diagnose which process parameter in the design has the
highest impact to cause measurement fail. Monte Carlo-based samples may
miss the actual worst case distance point in the generated samples.
Solido High-Sigma MC: verifies the accuracy based on existing samples of
"up to 1 K - 20 K simulations." The failed tail points may not be picked
up for simulation/verification if they are not captured in the data-mining
model. Verifiability really depends on how accurate the high-dimensional
data mining model is.
Also, the worst case distance point in the statistical space can be used to
create worst case statistical corners which can be extrapolated to the
desired yield target. It can be used to efficiently improve the yield of
the measurements to the desired target yield.
Virtuoso ADE GXL offers worst case distance-based high yield estimation and
optimization. Virtuoso ADE GXL is now part of TSMC AMS reference flow 3.0.
- Hongzhou Liu
Cadence Design Systems, Inc. Pittsburgh, PA
---- ---- ---- ---- ---- ---- ----
From: [ Mehmet Cirit of LibTech ]
Hi John,
Looking through the Solido response in ESNUG 513 #6, I don't see anything
which invalidates any of my original arguments.
On the contrary, I see the confirmation that Solido starts out with apriori
knowledge of a high level distribution function like delay probability
distribution and apparently use that info somehow to narrow/scale eventual
simulation region.
If you already�know such a function, there is no need to go any further;
one can� calculate the yield/confidence level from that function. �If the
purpose�of proceeding further is to improve a priorily known distribution,
that can't be done by focusing on a narrow band. Instead one needs to
search the whole variation space, update the distribution, and calculate
the area of the region of interest, that is, the region with less than
6-sigma. That naturally changes the value of sigma itself. I did not get
the sense with Solido that there is such an objective, though.�
In any case, if
L = Ln + dL
and dL is some random variable, dL can not be less than -Ln irrespective of
what the Gaussian distribution may say about its probability. Such physical
constraints distort and invalidate any analysis claiming to account for
large variations and their probabilities.
Furthermore, such constraints may be device- and operating-point specific.
I haven't looked at the paper cited. Looking at various SPICE models,�I
don't see any way they can avoid such issues. Search space is riddled�
with no go zones, if you ignore them, whatever distribution you are�
working with or calculating will be wrong substantially.
I stand by my assertion that if you design your bit cell to have a failure
rate of 1e-6 due to random local variations, and if you have 1e+6 such
cells on your chip, every chip will have one sure failure. That is a
simple exercise in probability calculus. However you throw the dice or
toss the coin, that result does not change. If such an outcome is the goal,
it is more worthwhile to have a cup of coffee, rest, play backgammon or go
home rather than worry about SPICE simulations.
Nobody is worried about little variations. �I suspect that the users of such
tools worry about large variations, and want to know how their design will
perform under such �conditions.
Failures don't necessarily happen at extremes, but could happen anywhere,
and the conditions are very specific to the circuit and its environs. �It is
very unlikely sampling techniques can identify such regions in a search
space with dimensions in the range of 100's to 1,000's and with lots of�
holes in it. Any yield or confidence numbers out of such analysis will
bear little semblance to reality. �They are also ill-suited to handle local
variation as my bit-cell example illustrates very well. �That is my point.
- Mehmet A. Cirit
Library Technologies, Inc. Saratoga, CA
Join
Index
Next->Item
|
|