( ESNUG 524 Item 5 ) -------------------------------------------- [05/16/13]
Subject: Solido brainiac rebukes Cadence's doubts of Solido 6-sigma claims
> I really appreciate Trent's explanation for what problem the current
> high yield solution algorithms are trying to solve in ESNUG 513 #6.
>
> - Hongzhou Liu of Cadence
> http://deepchip.com/items/0523-08.html
From: [ Trent McConaghy of Solido Design ]
Hi, John,
I appreciate the interest that Hongzhou Liu of Cadence has demonstrated with
Solido's High-Sigma Monte Carlo (HSMC) product, and to the challenges of
high-sigma analysis in general.
I'd like to take this opportunity to respond.
> There are different algorithms to identify the worst case distance
> point in statistical space which are not limited to linear sensitivity
> or quadratic model. A good nonlinear optimization algorithm can
> identify the worst case distance point in a very non-linear spec
> boundary in statistical space.
Agreed. There are many techniques to find the worst case distance (WCD)
point. WCD was not the focus of my post. Thanks to Hongzhou for the
expanded explanation of WCD.
> The linearity/non-linearity mapping between statistical parameter
> to performance does not imply how difficult it is to identify the
> worst case distance point. The non-linear mapping and non-Gaussian
> distribution may have a very linear spec contour plot in the
> statistical space, which helps to find worst case distance point
> very easily.
>
> For example, when we try to explore the vth variation for SRAM cell...
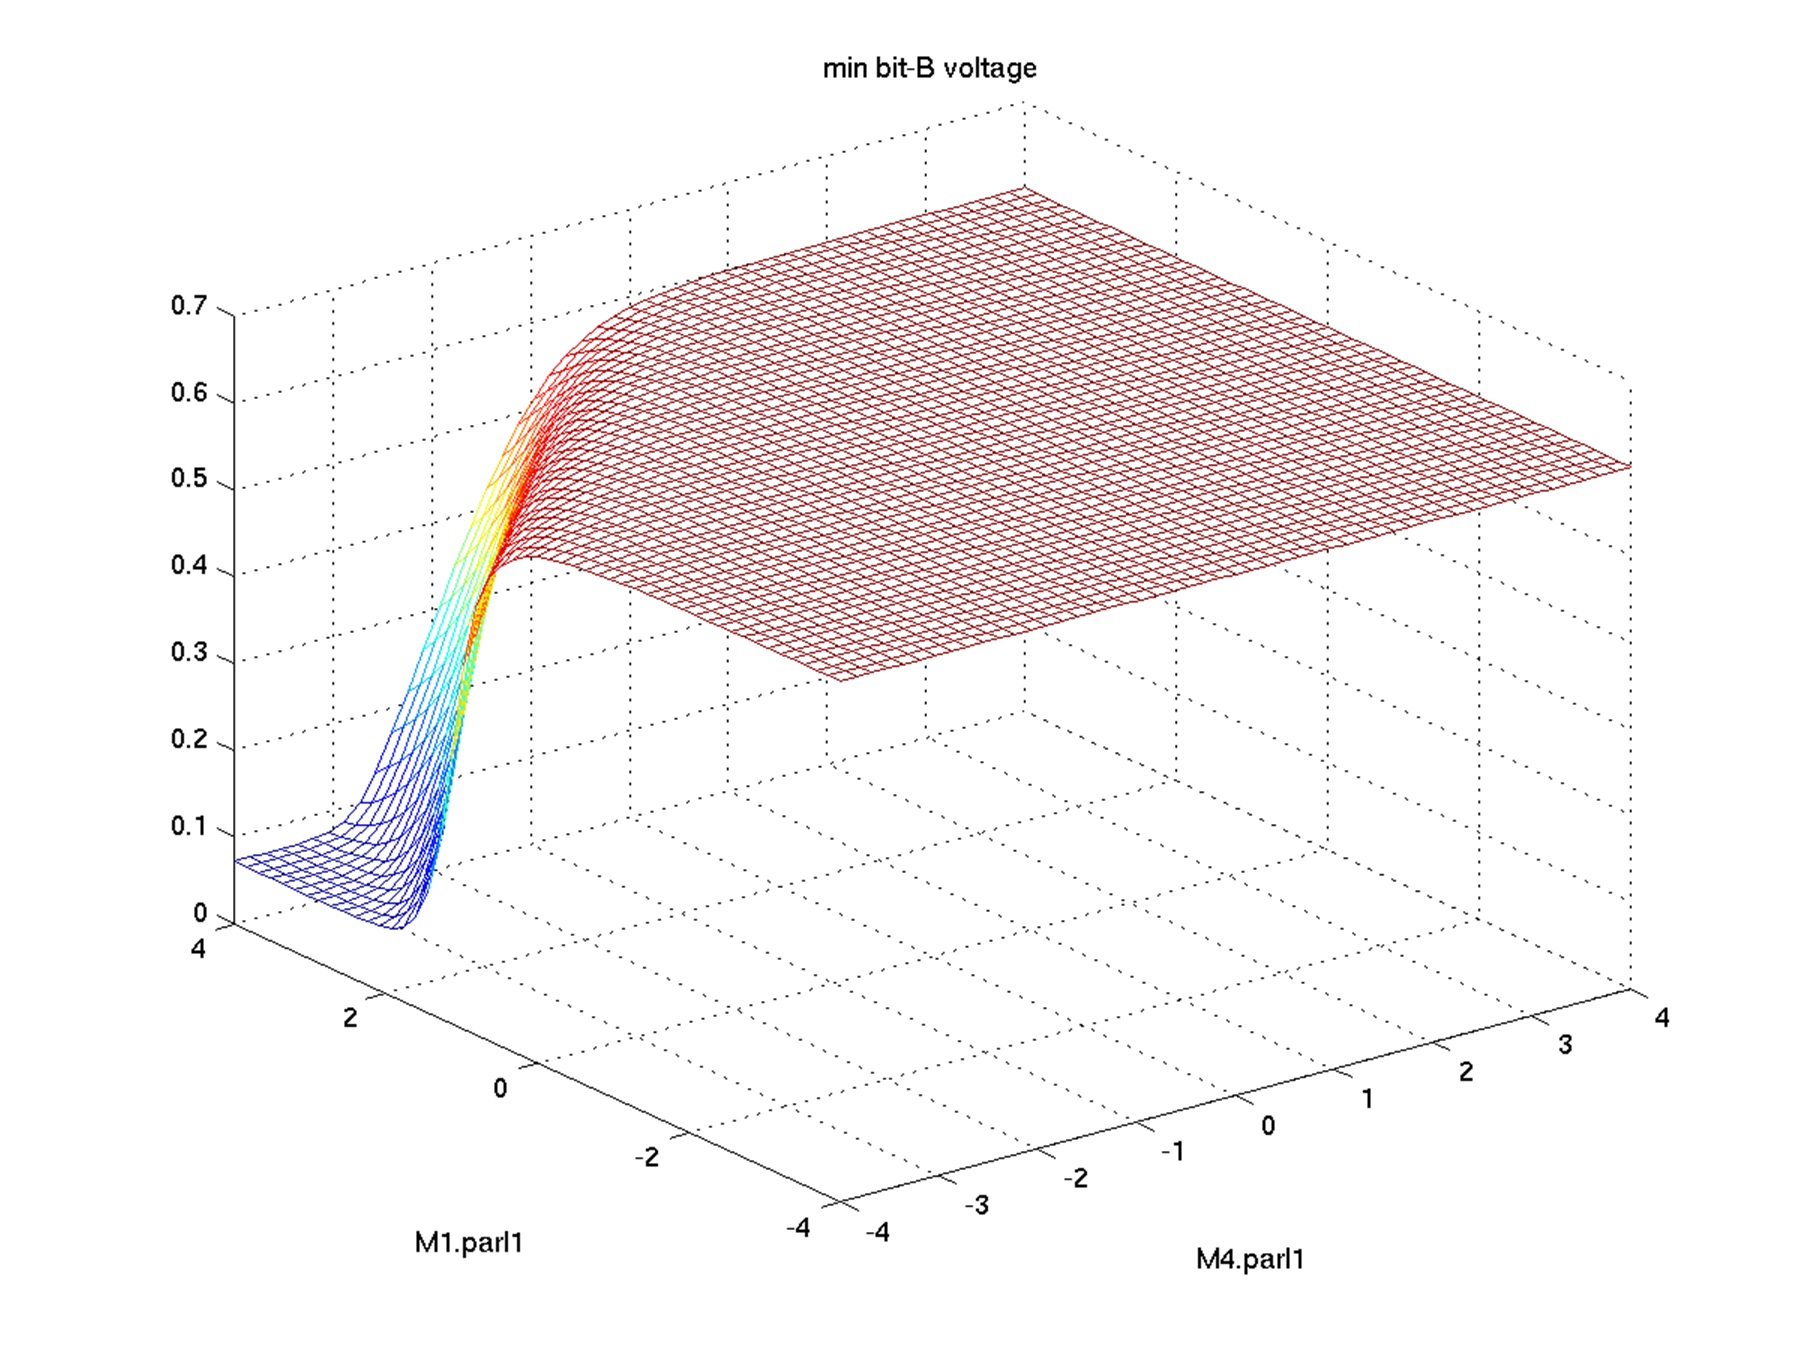 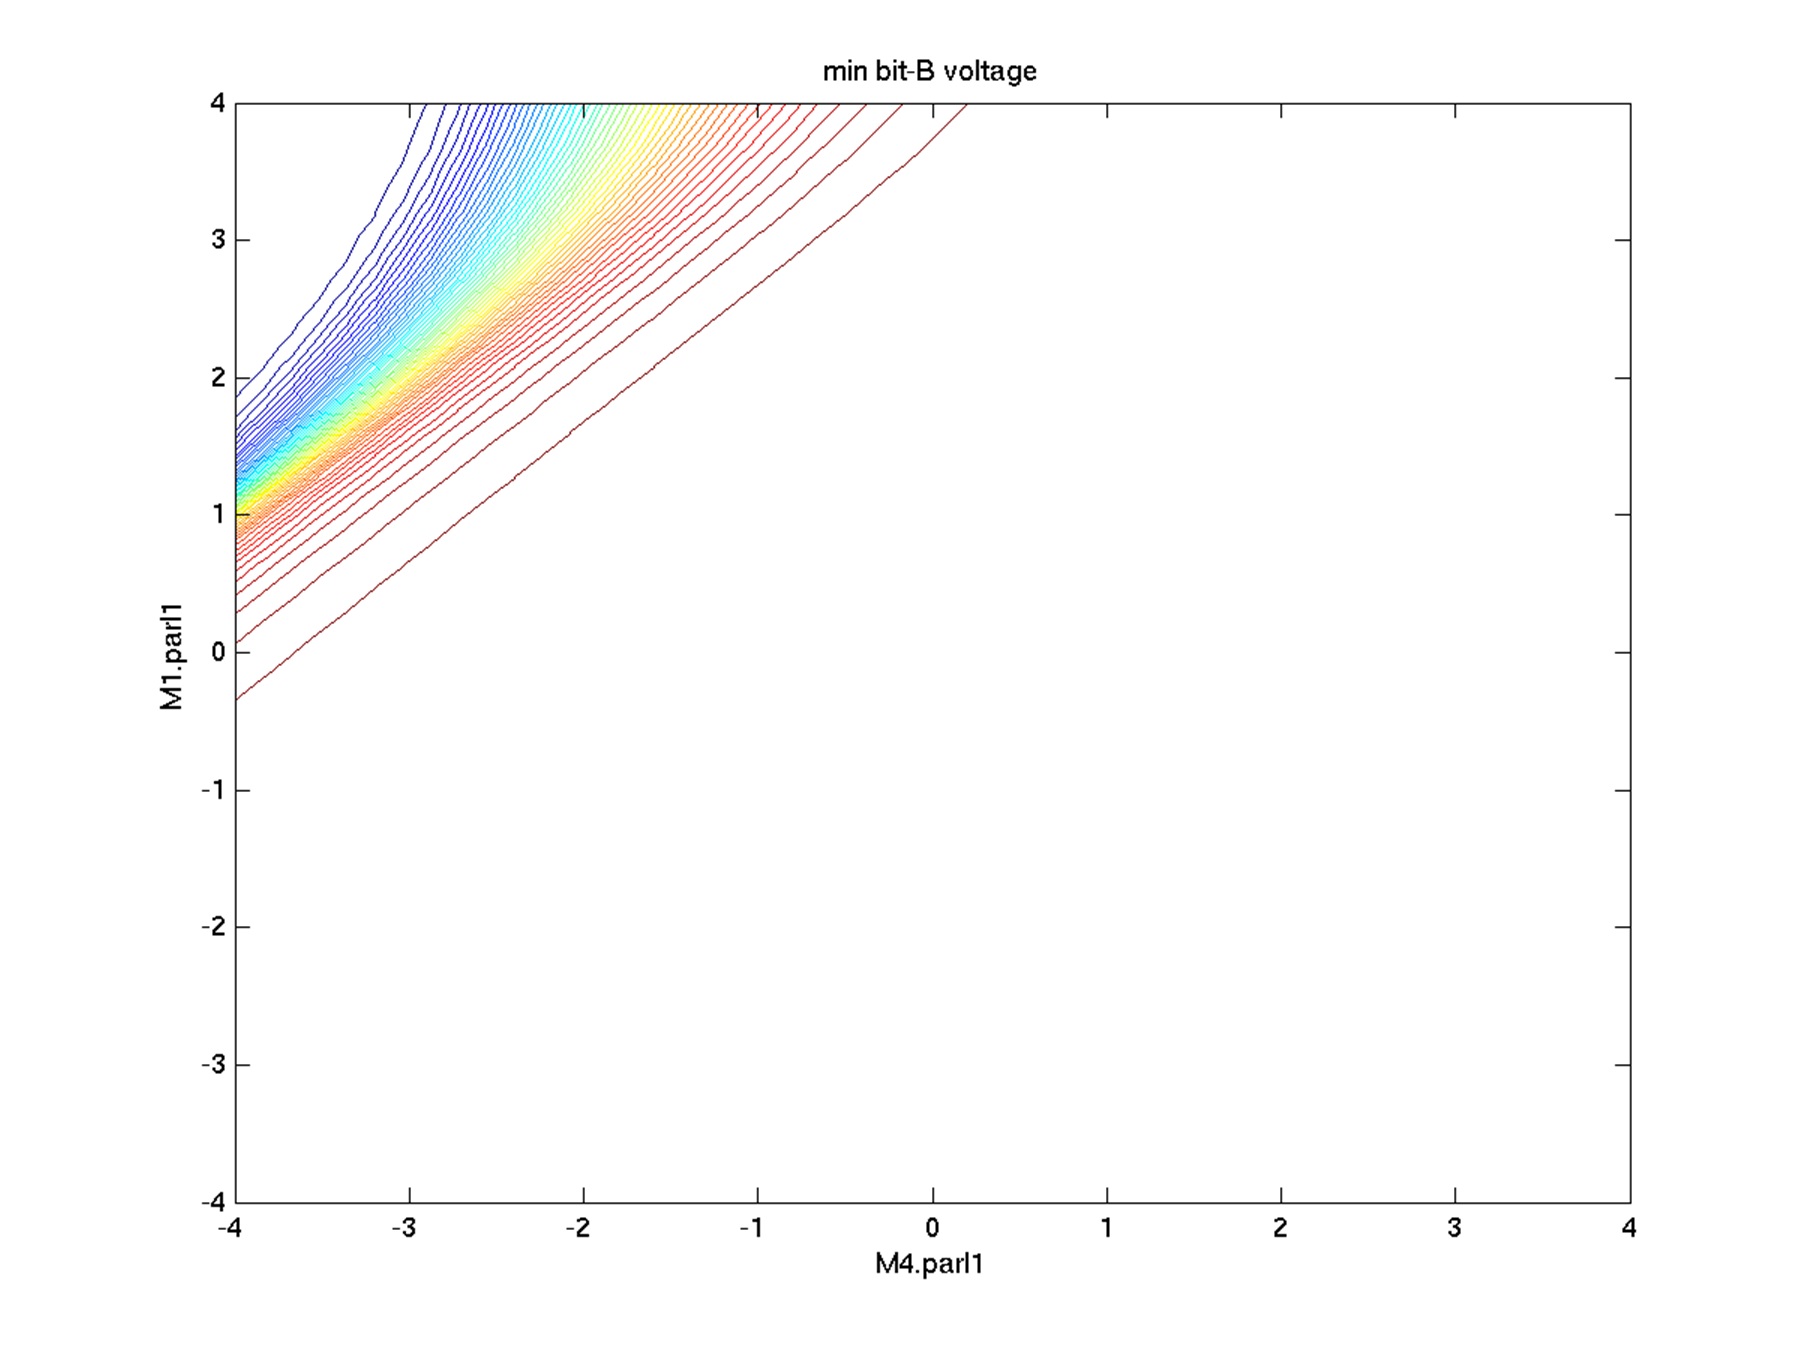 Figure 1: SRAM bit voltage vs. statistical variables. Left -
surface plot. Right - contour plot. From: ESNUG 523 #8
I agree that a nonlinear mapping from statistical parameters to performance
may lead to a linear spec contour plot (feasibility boundary), as Hongzhou's
images eloquently show.
However, after observing that one particular circuit setup has a linear
feasibility boundary, it would be false logic to conclude that all circuit
setups (or even all bitcell setups) have a linear feasibility boundary.
Just as seeing one green Furby doesn't mean that all Furbies are green! :)
The main question is: what assumptions can we make about feasibility
boundaries, for bitcells and circuits in general? For example, can we assume
a linear boundary? Quadratic? Let's examine more data, from the literature
and from some experiments.
The images below are from researchers from Berkeley / U Minn. Like
Hongzhou's data, the images sweep the two key variation parameters of a
bitcell. The left image shows the mapping from process variables to output,
and the right image is a feasibility boundary, a horizontal slice through
the surface of mapping. The infeasible region is in the top right of the
right image.
Figure 1: SRAM bit voltage vs. statistical variables. Left -
surface plot. Right - contour plot. From: ESNUG 523 #8
I agree that a nonlinear mapping from statistical parameters to performance
may lead to a linear spec contour plot (feasibility boundary), as Hongzhou's
images eloquently show.
However, after observing that one particular circuit setup has a linear
feasibility boundary, it would be false logic to conclude that all circuit
setups (or even all bitcell setups) have a linear feasibility boundary.
Just as seeing one green Furby doesn't mean that all Furbies are green! :)
The main question is: what assumptions can we make about feasibility
boundaries, for bitcells and circuits in general? For example, can we assume
a linear boundary? Quadratic? Let's examine more data, from the literature
and from some experiments.
The images below are from researchers from Berkeley / U Minn. Like
Hongzhou's data, the images sweep the two key variation parameters of a
bitcell. The left image shows the mapping from process variables to output,
and the right image is a feasibility boundary, a horizontal slice through
the surface of mapping. The infeasible region is in the top right of the
right image.
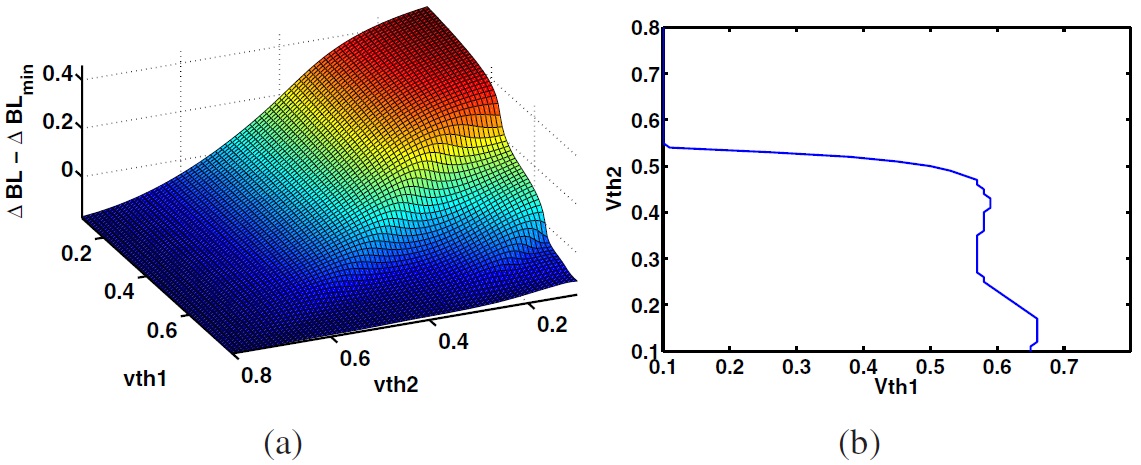 Figure 2: SRAM delta bit voltage vs. statistical variables. Left -
surface plot. Right - feasibility boundary. From: C. Gu and J.
Roychowdhury, "An Efficient, Fully Nonlinear, Variability Aware
non-Monte-Carlo Yield Estimation Procedure with Applications to
SRAM cells and Ring Oscillators", Proc. ASPDAC, 2008, Fig. 6.
The feasibility boundary is clearly not linear, or even quadratic.
I recreated the problem, and then annotated the plot with WCD algorithm
behavior as shown below.
Figure 2: SRAM delta bit voltage vs. statistical variables. Left -
surface plot. Right - feasibility boundary. From: C. Gu and J.
Roychowdhury, "An Efficient, Fully Nonlinear, Variability Aware
non-Monte-Carlo Yield Estimation Procedure with Applications to
SRAM cells and Ring Oscillators", Proc. ASPDAC, 2008, Fig. 6.
The feasibility boundary is clearly not linear, or even quadratic.
I recreated the problem, and then annotated the plot with WCD algorithm
behavior as shown below.
 Figure 3: WCD algorithm behavior on SRAM delta bit voltage vs.
statistical variables. Includes contour plot and feasibility
boundary.
The dashed red circle has the smallest possible radius while still touching
the infeasibility boundary. The WCD point is at the intersection of the
circle and the true feasibility boundary. The linear feasibility boundary
about the WCD point is shown.
The WCD algorithm misses a major portion of the infeasible region, which
means it significantly overestimates yield.
A quadratic boundary wouldn't capture the full nonlinearity either. One
might consider even making more strongly nonlinear boundaries about the WCD
point, but since much of the failure region is far from the WCD point, that
won't help.
Trying to somehow use a WCD point is actually getting in the way of getting
an accurate boundary.
Let's look at more data from the literature. The image below left is from
researchers from CMU. Once again, it is for a bitcell varying two vth
parameters. The green and black glyphs denote the infeasible region, and
the clear area is the feasible region. Below right is the same data redrawn
with WCD behavior. Once again, we see that WCD approaches would
significantly overestimate yield.
Figure 3: WCD algorithm behavior on SRAM delta bit voltage vs.
statistical variables. Includes contour plot and feasibility
boundary.
The dashed red circle has the smallest possible radius while still touching
the infeasibility boundary. The WCD point is at the intersection of the
circle and the true feasibility boundary. The linear feasibility boundary
about the WCD point is shown.
The WCD algorithm misses a major portion of the infeasible region, which
means it significantly overestimates yield.
A quadratic boundary wouldn't capture the full nonlinearity either. One
might consider even making more strongly nonlinear boundaries about the WCD
point, but since much of the failure region is far from the WCD point, that
won't help.
Trying to somehow use a WCD point is actually getting in the way of getting
an accurate boundary.
Let's look at more data from the literature. The image below left is from
researchers from CMU. Once again, it is for a bitcell varying two vth
parameters. The green and black glyphs denote the infeasible region, and
the clear area is the feasible region. Below right is the same data redrawn
with WCD behavior. Once again, we see that WCD approaches would
significantly overestimate yield.
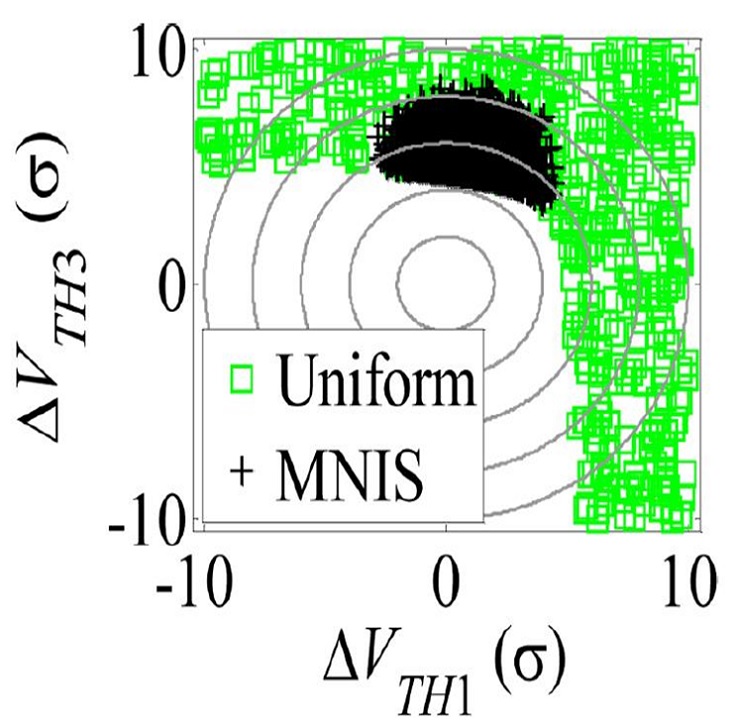 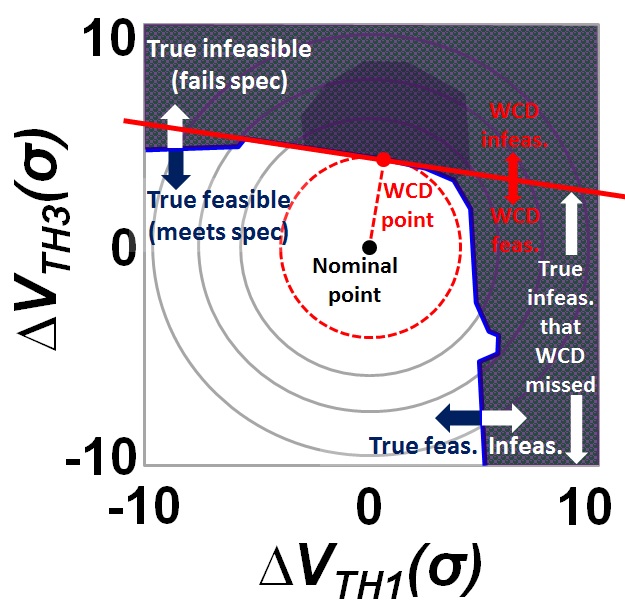 Figure 4: Left -- SRAM delta bit voltage feasibility vs. statistical
variables. Right -- WCD algorithm behavior on SRAM feasibility
boundary. Left is from: S. Sun et al., "Efficient SRAM failure rate
prediction via Gibbs sampling," IEEE TCAD 31(12), Dec. 2012, Fig. 13b.
Below is another example, on static noise margin of a 6 transistor bitcell
in 28nm TSMC, measuring the same variables in Hongzhou's post - M1.parl1 vs.
M4.parl1. The infeasible region is in the top left, at any one of the
contour lines, depending on the spec. Clearly, the boundaries are
nonlinear.
Figure 4: Left -- SRAM delta bit voltage feasibility vs. statistical
variables. Right -- WCD algorithm behavior on SRAM feasibility
boundary. Left is from: S. Sun et al., "Efficient SRAM failure rate
prediction via Gibbs sampling," IEEE TCAD 31(12), Dec. 2012, Fig. 13b.
Below is another example, on static noise margin of a 6 transistor bitcell
in 28nm TSMC, measuring the same variables in Hongzhou's post - M1.parl1 vs.
M4.parl1. The infeasible region is in the top left, at any one of the
contour lines, depending on the spec. Clearly, the boundaries are
nonlinear.
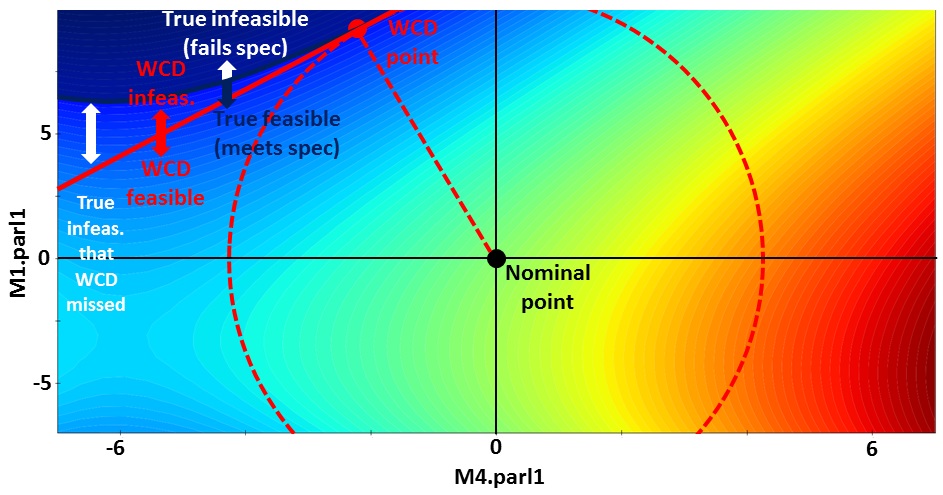 Figure 5: SRAM static noise margin vs. statistical variables.
Includes contour plot, feasibility boundary, and a linear-WCD
estimated feasibility boundary.
We've now demonstrated seen how WCD approaches may have accuracy issues even
on two-dimensional bitcell problems.
Let us compare the behavior of the WCD approach to Solido High-Sigma Monte
Carlo (HSMC) behavior on the same problem. Below left is a copy of Figure
3, which shows WCD behavior on the data from Gu et al. Below right is
Solido HSMC behavior on the same problem. Solido HSMC considered 20K Monte
Carlo (MC) samples, and used 1,500 simulations.
Solido HSMC has simulated all MC samples in the infeasible region, which
means it has found all failures and estimates yield with the same accuracy
as a large "brute force" MC run.
Figure 5: SRAM static noise margin vs. statistical variables.
Includes contour plot, feasibility boundary, and a linear-WCD
estimated feasibility boundary.
We've now demonstrated seen how WCD approaches may have accuracy issues even
on two-dimensional bitcell problems.
Let us compare the behavior of the WCD approach to Solido High-Sigma Monte
Carlo (HSMC) behavior on the same problem. Below left is a copy of Figure
3, which shows WCD behavior on the data from Gu et al. Below right is
Solido HSMC behavior on the same problem. Solido HSMC considered 20K Monte
Carlo (MC) samples, and used 1,500 simulations.
Solido HSMC has simulated all MC samples in the infeasible region, which
means it has found all failures and estimates yield with the same accuracy
as a large "brute force" MC run.
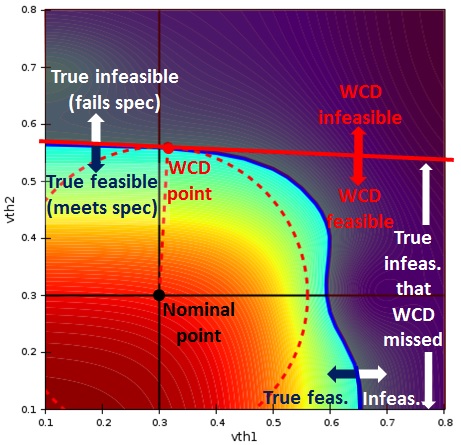 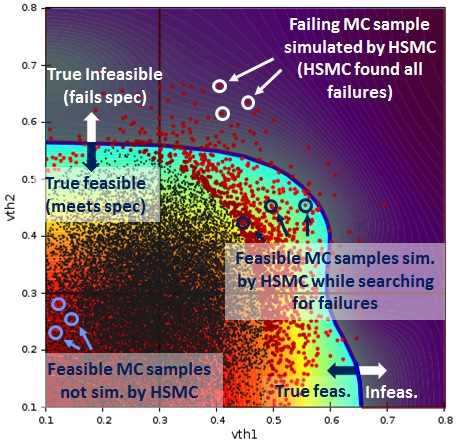 Figure 6: SRAM delta bit voltage vs. statistical variables,
including contour plot and feasibility boundary. Left -- WCD
algorithm behavior. Right -- Solido HSMC behavior.
Of course, only varying vth is not a realistic model of variation on modern
geometries. Modern models of variation have local 5-10 process variables
per device- which for a 6T bitcell totals 30-60 local process variables; as
well as global variation and environmental conditions like temperature and
load.
Furthermore, bitcells are only one application of high-sigma tools; we have
designers using Solido HSMC for
- sense amps (~150 variables) and other memory circuits,
- digital standard cells (e.g. ~180 variables for a flip flop),
- custom digital circuits, clock tree circuits (>10K variables),
- and more.
---- ---- ---- ---- ---- ---- ----
> The following are my comments on the chart in ESNUG 513 #6 comparing...
> [compared in terms of Simulation Reduction Factor, Accuracy, Scalability,
> Verifiability]
I'm glad Hongzhou focused in on the key elements I outlined early. It is
useful to have a common framework for discussion purposes. Great!
Below I have updated the chart to capture his expanded WCD description.
Figure 6: SRAM delta bit voltage vs. statistical variables,
including contour plot and feasibility boundary. Left -- WCD
algorithm behavior. Right -- Solido HSMC behavior.
Of course, only varying vth is not a realistic model of variation on modern
geometries. Modern models of variation have local 5-10 process variables
per device- which for a 6T bitcell totals 30-60 local process variables; as
well as global variation and environmental conditions like temperature and
load.
Furthermore, bitcells are only one application of high-sigma tools; we have
designers using Solido HSMC for
- sense amps (~150 variables) and other memory circuits,
- digital standard cells (e.g. ~180 variables for a flip flop),
- custom digital circuits, clock tree circuits (>10K variables),
- and more.
---- ---- ---- ---- ---- ---- ----
> The following are my comments on the chart in ESNUG 513 #6 comparing...
> [compared in terms of Simulation Reduction Factor, Accuracy, Scalability,
> Verifiability]
I'm glad Hongzhou focused in on the key elements I outlined early. It is
useful to have a common framework for discussion purposes. Great!
Below I have updated the chart to capture his expanded WCD description.
|
factor
|
Standard Monte Carlo
|
Solido High-Sigma MC
|
Importance Sampling
|
Extrapolation
|
Worse Case Distance
|
|
Simulation Reduction Factor
|
1 X
|
1 Million X
|
1 Million X
|
1 Million X
|
1 Million X
|
|
Accurate?
|
YES.
Draws samples from actual distr. until enough tail samples.
|
YES.
Draws samples from actual distr., simulates tail samples.
|
NO.
Distorts away from the actual distr. towards tails.
|
NO.
From MC samples, extrapolates to tails.
|
NO.
Estimated feasibility boundary about WCD point typically assumes linear or quadratic. Assumes 1 failure region per output.
|
|
Scalable?
|
YES.
Unlimited process variables
|
YES.
1000+ process variables
|
NO.
10-20 process variables
|
YES.
Unlimited process variables
|
OK.
Modern approaches screen variables to keep simulation costs low.
|
|
Verifiable?
|
YES.
Simple, transparent behavior
|
YES.
Transparent convergence (akin to SPICE KCL/KVL)
|
NO.
Cannot tell when inaccurate
|
NO.
Cannot tell when inaccurate
|
NO.
Cannot tell when inaccurate
|
> ACCURACY
>
> For Solido High-Sigma MC, the error comes from two parts:
>
>   1.  The modeling error comes from "Data-mines the relation from
>       *input* process variables to *output*.  High-dimensional
>       non-linear data mining modeling is very challenging especially
>       to get high accuracy.

Agreed, it can be challenging to get high accuracy.  However, from my
previous post (ESNUG 513 #6), the HSMC data mining does not require high
accuracy.  It only requires sufficient accuracy to prioritize the
simulations.  That's a *far* easier problem.  Furthermore, Solido has deep
experience in data mining; I've personally been doing it since my time at
National Defence in the late 90's.


> SCALABILITY
>
> Solido High-Sigma MC: The efficiency of high-dimensional data mining
> impacts both Solido High-Sigma MC and the pre-processing of WCD-based
> approach.

Actually, data mining model-building is typically <5% of the overall HSMC
runtime -- just a tiny fraction.


> VERIFIABILITY
>
> Solido High-Sigma MC: verifies the accuracy based on existing samples of
> "up to 1 K - 20 K simulations."  The failed tail points may not be picked
> up for simulation/verification if they are not captured in the data-mining
> model.  Verifiability really depends on how accurate the high-dimensional
> data mining model is.

I believe Hongzhou may have misinterpreted what I mean by verifiability.
From my previous post (ESNUG 513 #6), here's how I think about it: "Would
the *user* be able to tell if the approach works or fails? For example, when
SPICE fails, the user can tell because KCL or KVL are violated."

Verifiability does not depend on accuracy of the HSMC data mining model.
Quite the opposite.  From my previous post: "we can tell if HSMC performs
poorly [due to an inaccurate model] by using an output vs. sample
convergence curve".  My previous post elaborates.  This curve is placed
front and center in the UI, making it easy for users to get an answer to
"how can I trust this?"


> WCD-based approach: the worst case distance point is simulated and
> verified to make sure it is a WCD point in statistical space.

Let's re-examine WCD on the problem in Figure 3 in light of verifiability.
Recall that Figure 3 shows how WCD can fail to estimate yield accurately.
Yet simulating at the WCD point in Figure 3 will not give any indication
that the WCD approach had failed.  This is a fundamental challenge.  Users
need to be able to trust their tools.

         ----    ----    ----    ----    ----    ----   ----

I believe I have addressed Hongzhou' key points, and clarified the issues I
see with WCD approaches versus the HSMC approach that Solido uses.

Now, I will clarify the points that Mehmet raised.

> I see the confirmation that Solido starts out with apriori knowledge of
> a high level distribution function like delay probability distribution
> and apparently use that info somehow to narrow/scale eventual simulation
> region.
>
> If you already know such a function, there is no need to go any further;
> one can calculate the yield/confidence level from that function.
>
>     - Mehmet A. Cirit of Lib Tech.
>       http://www.deepchip.com/items/0523-08.html

It appears that Mehmet has misinterpreted what Solido HSMC does.  HSMC does
not input any high-level function for an output such as delay.  The a priori
knowledge that Solido HSMC does input is merely a single integer: how many
MC samples to consider.

Users have a good enough idea of their circuit's failure rate (e.g. 4 sigma
vs. 5 sigma) that they can easily pick this integer.  If they truly didn't
know then they could simply enter a huge number like 5G.  Solido HSMC will
proceed as usual, adapting its simulations towards the MC samples at the
tail of the output, so that only 1K to 20K simulations total are needed.


> I stand by my assertion that if you design your bit cell to have a failure
> rate of 1e-6 due to random local variations, and if you have 1e+6 such
> cells on your chip, every chip will have one sure failure.

I agree that there would be one expected failure on this example, sure.
(If no redundancy, no error correction, etc.) But nobody is claiming that
one would design a 1Mbit circuit using bitcells having failure rates of
1e-6.  Sometimes test problems have a higher failure rate simply to
facilitate comparison on a broader set of approaches.


> Failures don't necessarily happen at extremes [of process variable space],
> but could happen anywhere

Agreed.  My discussion in ESNUG 513 #6, exemplified by the figure with
caption "Behavior of HSMC under a quadratic mapping" illustrates how HSMC
easily handles cases when failures are closer to nominal.


> and the conditions are very specific to the circuit and its environs.

Agreed.  Solido HSMC uses SPICE in the loop, which of course inputs netlists
that describe the specifics of the circuit and its environment.


CONCLUSION

I would like to thank Hongzhou for his elaboration on worst case distance
(WCD) approaches.  I hope my reply will help to improve understanding of the
challenges encountered by WCD approaches.  Also, I would like to thank both
Hongzhou and Mehmet for their interest in Solido HSMC.  Solido is excited to
have our customers getting simulation reductions of 100x+ from our HSMC
approach with improved design coverage, while meeting their other key
requirements for accuracy, scalability and verifiability.

    - Trent McConaghy
      Solido Design     	                 Vancouver, Canada
Join
Index
Next->Item
|
|