( ESNUG 531 Item 6 ) -------------------------------------------- [08/08/13]
Subject: MunEDA wunderkind says WCD yield tramples Solido High-Sigma MC
> I include the results comparison between 30 million Monte Caro runs and
> 300 simulations from a Virtuoso ADE GXL Worst Case Distance run using
> 28 nm statistical model. The measured result is read current from
> a 6-cell SRAM.
>
> Yield (sigma) 3.0 3.5 4.0 4.5 5.0 5.5
>
> 30 million MC results 2.378 2.139 1.912 1.695 1.520 1.371
> WCD Run (300 sims) 2.423 2.177 1.948 1.736 1.539 1.359
>
> Circuit may have multiple failure modes in statistical space. However,
> they can be captured using different Worst Case Distance measurements.
>
> For Solido High-Sigma MC, the error comes from two parts:
>
> 1. The modeling error comes from "Data-mines the relation from
> *input* process variables to *output*". High-dimensional
> non-linear data mining modeling is very challenging especially
> to get high accuracy.
>
> 2. The yield estimation is limited to 5 billion samples which are
> generated up front to predict 6-sigma yield.
>
> Another advantage of Worst Case Distance-based approach is that it is not
> limited to 6-sigma yield.
>
> - Hongzhou Liu of Cadence
> http://www.deepchip.com/items/0523-08.html
From: [ Michael Pronath of MunEDA ]
Hi John,
Thank you for the interesting discussions on high yield estimation.
Hongzhou Liu's post illustrates well why WCD shows excellent accuracy in
practice even in presence of strong one-dimensional non-linearity.
At MunEDA we use both ways (WCD and sampling) for circuits and are kind of
marketing-neutral about it. I think in ESNUG 524-05 Trent correctly points
out a potential cause of error in WCD, but he doesn't calculate its amount
and ignores the sampling error and high-sigma capacity issues of HSMC, so
let me address these points.
In most previous posts, WCD was treated like a fast/coarse approximation to
a more accurate HSMC result; this couldn't be more wrong.
For 6-sigma analysis, WCD should be chosen over HSMC not only because it's
faster, but because WCD is more accurate than HSMC. While deterministic
methods like WCD show an error due to their linear approximation of the non-
linear spec boundary, sampling methods -- like importance sampling or
HSMC -- show a sampling error depending on the sample size. In 6-sigma
robustness analysis, this sampling error is often larger than the non-
linearity error even for very large sample size.
SOLIDO IS MISLEADING:
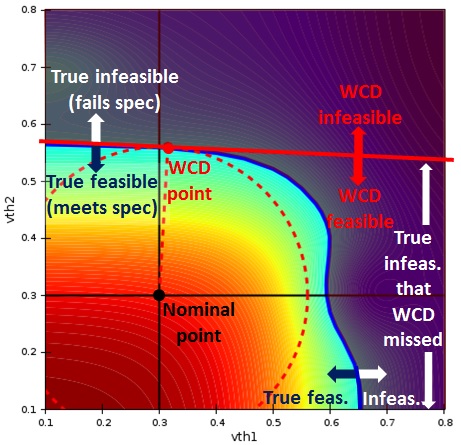 ESNUG 0524-05: WCD algorithm behavior on SRAM delta bit voltage vs.
statistical variables. Includes contour plot and feasibility
boundary.
"The WCD algorithm misses a major portion of the infeasible region,
which means it significantly overestimates yield."
In ESNUG 524-05, Solido doesn't do the math about error figures, but only
shows contour plots that suggest WCD has problems. That's misleading
because error depends a lot on the distribution density which is not visible
in these plots. As I know you like numbers, John, let's have a look at it.
Ironically, Solido's examples again show how well WCD works, beating HSMC
at high sigma capacity.
---- ---- ---- ---- ---- ---- ----
My first two examples are from academic papers tailored to demo tools for
non-linear spec regions. Nevertheless, their function shape shows nicely
the density effect in error analysis (x1, x2 std.normal input variables,
e.g. normalized Vth):
ESNUG 0524-05: WCD algorithm behavior on SRAM delta bit voltage vs.
statistical variables. Includes contour plot and feasibility
boundary.
"The WCD algorithm misses a major portion of the infeasible region,
which means it significantly overestimates yield."
In ESNUG 524-05, Solido doesn't do the math about error figures, but only
shows contour plots that suggest WCD has problems. That's misleading
because error depends a lot on the distribution density which is not visible
in these plots. As I know you like numbers, John, let's have a look at it.
Ironically, Solido's examples again show how well WCD works, beating HSMC
at high sigma capacity.
---- ---- ---- ---- ---- ---- ----
My first two examples are from academic papers tailored to demo tools for
non-linear spec regions. Nevertheless, their function shape shows nicely
the density effect in error analysis (x1, x2 std.normal input variables,
e.g. normalized Vth):
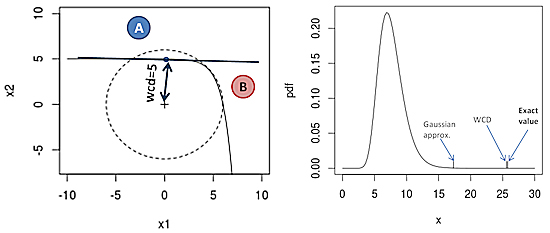 Fig.1: Effect of non-linear spec region on WCD estimate.
At a first glance, missing failure region B looks like a problem in the
contour plot of Fig.1. But considering the density, the error in the
quantile is under 0.03 sigma. WCD optimistically returns a 5-sigma
quantile that is actually only a 4.97-sigma quantile. The right side plot
shows what that means in a long-tail log-normal output distribution.
MISLEADING ASPECT RATIO:
The 3rd case in ESNUG 0524-05 is a 28nm TSMC bit cell SNM plot:
Fig.1: Effect of non-linear spec region on WCD estimate.
At a first glance, missing failure region B looks like a problem in the
contour plot of Fig.1. But considering the density, the error in the
quantile is under 0.03 sigma. WCD optimistically returns a 5-sigma
quantile that is actually only a 4.97-sigma quantile. The right side plot
shows what that means in a long-tail log-normal output distribution.
MISLEADING ASPECT RATIO:
The 3rd case in ESNUG 0524-05 is a 28nm TSMC bit cell SNM plot:
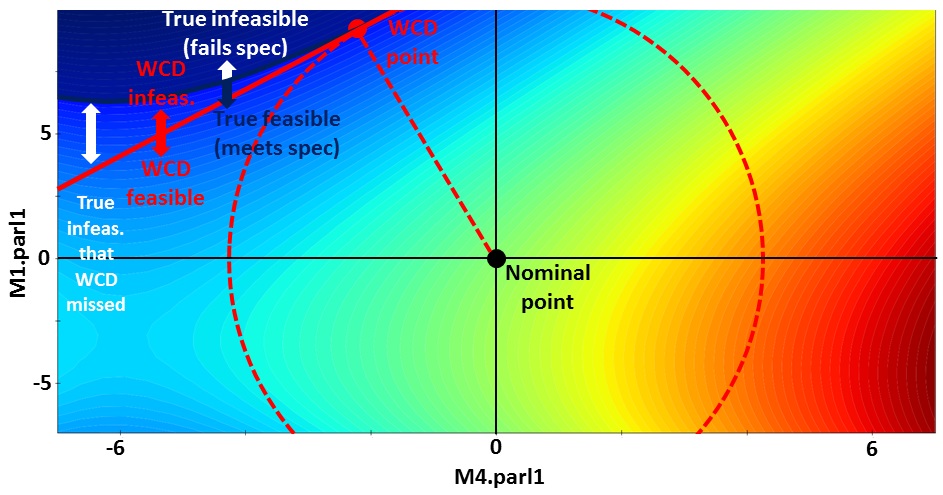 ESNUG 0524-05: SRAM static noise margin vs. statistical variables.
"We've now demonstrated seen how WCD approaches may have accuracy
issues even on two-dimensional bitcell problems."
The aspect ratio of the plot axes isn't 1:1 -- showing the WCD point in the
wrong position and exaggerating the error. Nevertheless, let's see the
effect of such a curvature on a 6-sigma WCD in numbers:
ESNUG 0524-05: SRAM static noise margin vs. statistical variables.
"We've now demonstrated seen how WCD approaches may have accuracy
issues even on two-dimensional bitcell problems."
The aspect ratio of the plot axes isn't 1:1 -- showing the WCD point in the
wrong position and exaggerating the error. Nevertheless, let's see the
effect of such a curvature on a 6-sigma WCD in numbers:
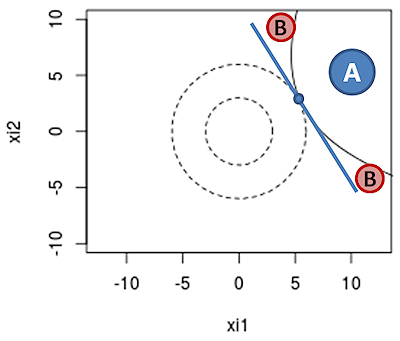 Fig.2: Effect of curvature on 6-sigma WCD estimate.
The curvature in Fig.2 makes WCD results too pessimistic by 0.045 sigma,
because WCD wrongly considers region B as failing. WCD returns a 6-sigma
quantile value that is actually a 6.045-sigma quantile. The effect of
curvature on quantile estimation with WCD is counterintuitively small,
because the normal density drops exponentially from the WCD point.
Now let's compare WCD's non-linearity error to the sampling error of a
5 billion sample Monte Carlo run in Fig.2. Out of 5 billion data points,
on average less than four come to lie in region A, and only 1 sample point
in region B. That's very coarse and makes the 95%-confidence interval due
to sampling error 0.33 sigma wide, 7X the error of WCD.
So, while there is a non-linearity error of WCD in Fig.2, it is still a lot
smaller than the sampling error of a 5 billion sample MC run. Reducing
sampling error to WCD error in Fig.2 takes over 50 billion MC samples; more
if it's a long tail and many more for higher robustness.
Larger memories ask for 6.5 sigma, which would take 880 billion MC points
upwards to beat WCD.
---- ---- ---- ---- ---- ---- ----
Unfortunately for Solido, the examples they and Cadence give (single-sided
with curvature) are the relevant case for bit cells. Hence one may expect
that 5 billion sample HSMC can occasionally beat WCD in a 3 - 4 sigma range;
whereas for high sigma analyses, a 5 billion sample HSMC run can be expected
to be far less accurate than WCD, even if the prediction model was perfect.
In order to estimate and compensate the non-linearity error of WCD, we offer
an "importance sampling" option. Why not HSMC? It's a matter of resolution
and capacity again. A 5K sample from a DMIS scheme like IBM uses in [1]
puts 1,250 sample points into region A+B (Fig.2), enough to improve WCD
accuracy. If we wanted to achieve the same resolution with HSMC, we would
have to create, predict and sort 1.27 trillion data vectors before any SPICE
simulation. That's a runtime and capacity problem.
---- ---- ---- ---- ---- ---- ----
I'd say importance sampling beats HSMC hands down not only in accuracy and
high-sigma capacity -- but also in verifiability. Importance sampling
enables unbiased estimators, bounding the variance and estimating errors.
Whereas if you sort input vectors by a model, then you give up all of these
important features in the hope of a little speed-up.
In other words, HSMC is different from DMIS for the very reason that DMIS
was carefully designed by statisticians to avoid doing what HSMC does.
By the way, WCD methods originated in the 1970's in structural engineering
as "first-order reliability methods" and "structural reliability index", and
are widely used for designing aircraft and highway bridges [2]. If you
don't trust WCD, it's better you don't go too far from home ... :)
- Michael Pronath
MunEDA GmbH Munich, Germany
[1] R Kanj, R Joshi, Sani R Nassif: Mixture importance sampling and
its application to the analysis of SRAM designs in the presence
of rare failure events. DAC 2006: 69-72.
[2] A S Novak, M S Szerszen: Structural reliability as applied to
highway bridges. Progress in Structural Engineering and
Materials 2(2): 218-224.
Fig.2: Effect of curvature on 6-sigma WCD estimate.
The curvature in Fig.2 makes WCD results too pessimistic by 0.045 sigma,
because WCD wrongly considers region B as failing. WCD returns a 6-sigma
quantile value that is actually a 6.045-sigma quantile. The effect of
curvature on quantile estimation with WCD is counterintuitively small,
because the normal density drops exponentially from the WCD point.
Now let's compare WCD's non-linearity error to the sampling error of a
5 billion sample Monte Carlo run in Fig.2. Out of 5 billion data points,
on average less than four come to lie in region A, and only 1 sample point
in region B. That's very coarse and makes the 95%-confidence interval due
to sampling error 0.33 sigma wide, 7X the error of WCD.
So, while there is a non-linearity error of WCD in Fig.2, it is still a lot
smaller than the sampling error of a 5 billion sample MC run. Reducing
sampling error to WCD error in Fig.2 takes over 50 billion MC samples; more
if it's a long tail and many more for higher robustness.
Larger memories ask for 6.5 sigma, which would take 880 billion MC points
upwards to beat WCD.
---- ---- ---- ---- ---- ---- ----
Unfortunately for Solido, the examples they and Cadence give (single-sided
with curvature) are the relevant case for bit cells. Hence one may expect
that 5 billion sample HSMC can occasionally beat WCD in a 3 - 4 sigma range;
whereas for high sigma analyses, a 5 billion sample HSMC run can be expected
to be far less accurate than WCD, even if the prediction model was perfect.
In order to estimate and compensate the non-linearity error of WCD, we offer
an "importance sampling" option. Why not HSMC? It's a matter of resolution
and capacity again. A 5K sample from a DMIS scheme like IBM uses in [1]
puts 1,250 sample points into region A+B (Fig.2), enough to improve WCD
accuracy. If we wanted to achieve the same resolution with HSMC, we would
have to create, predict and sort 1.27 trillion data vectors before any SPICE
simulation. That's a runtime and capacity problem.
---- ---- ---- ---- ---- ---- ----
I'd say importance sampling beats HSMC hands down not only in accuracy and
high-sigma capacity -- but also in verifiability. Importance sampling
enables unbiased estimators, bounding the variance and estimating errors.
Whereas if you sort input vectors by a model, then you give up all of these
important features in the hope of a little speed-up.
In other words, HSMC is different from DMIS for the very reason that DMIS
was carefully designed by statisticians to avoid doing what HSMC does.
By the way, WCD methods originated in the 1970's in structural engineering
as "first-order reliability methods" and "structural reliability index", and
are widely used for designing aircraft and highway bridges [2]. If you
don't trust WCD, it's better you don't go too far from home ... :)
- Michael Pronath
MunEDA GmbH Munich, Germany
[1] R Kanj, R Joshi, Sani R Nassif: Mixture importance sampling and
its application to the analysis of SRAM designs in the presence
of rare failure events. DAC 2006: 69-72.
[2] A S Novak, M S Szerszen: Structural reliability as applied to
highway bridges. Progress in Structural Engineering and
Materials 2(2): 218-224.
Join
Index
Next->Item
|
|