( ESNUG 533 Item 5 ) -------------------------------------------- [10/15/13]
Subject: Solido brainiac Trent on user comments, and MunEDA WCD questions
> "The tool (due to my doctoral background in variation-aware stuff) that
> interested me is Solido's Variation Designer - a tool for PVT variation
> aware logic (standard cell) and memory (bit cell, sense amps...)
> characterization and optimization.
>
> Since the feasibility of larger designs was not evaluated, I found
> Solido more suitable for analog/RF components."
>
> - from http://www.deepchip.com/items/dac13-04.html
From: [ Trent McConaghy of Solido Design ]
Hi, John,
To clarify, Solido tools are useful for variation-aware std logic and memory
(bit cell, sense amps), because such circuitry is highly susceptible to
variation -- and because we SPICE-simulates quickly. Designers also use
Solido on much larger circuits with longer simulation times, such as memory
columns, and larger analog/RF and custom digital blocks.
This user may not know that Solido capacity may be higher than he realizes;
here's some numbers for Variation Designer 3.0, just released in September:
- Solido Fast PVT: 20 M devices, 3.2 B netlists, 10 M corner
combinations. Speedup (SPICE simulation reduction) of 10X+.
- Solido Fast Monte Carlo: 1 M devices, 1 M Monte Carlo samples.
SPICE speedup of 2X-10X.
- Solido High-Sigma Monte Carlo: 212 B Monte Carlo samples, 10 K+
variables. Speedup of 100X+.
> "When it comes to pure variation-aware circuits and SPICE simulation,
> Solido seems to be better at it than MunEDA. Solido was a more dry
> tool displaying raw numbers and ASCII characters on the screen for you
> to look at."
>
> "Solido Viewer: The simulation window gives you a view of total SPICE
> simulations, current running simulations, and how far along the total
> job is. As each SPICE run completes you can see the results in
> real-time."
Solido tools thoroughly support both visual and text-based interactions,
(example shown in Fig 1 below) as we've found that different users have
different preferences for visual versus text display.
Most users like a mix. They start with the big picture visually, looking at
histograms, variable impacts, sweeps, and the like; then they drill down to
individual simulation results waveforms ando view simulation log files.
As an example, in the Solido screenshot below, both the top and the bottom
show the same data, with the same x-axis (leakage power), but with different
y-axis scalings (top -- probability density, bottom -- normal quantile).
 Fig 1: Screenshot from Solido Variation Design GUI.
(click on pic to enlarge)
The top builds intuition -- and the bottom allows analysis between quantile
and output. Both images show each simulated sample. A right click on a
sample gives the option to see waveforms, simulation logs, and more. Both
top and bottom also show the estimated density curve, which is clearly
non-Gaussian; in this case, a long tail.
---- ---- ---- ---- ---- ----
Next, I would also like to respond in-depth to MunEDA's comments on Solido's
High Sigma Monte Carlo (HSMC) versus MunEDA's Worst Case Distances (WCD).
For the benefit of those just entering this thread, I will quickly define
each technique.
Worst Case Distances (WCD) and Importance Sampling (IS)
Both first find the process point (WCD point) that has highest probability
of failure, typically using a local optimizer like sequential quadratic
programming (SQP). Then WCD typically assumes a linear feasibility boundary
around that WCD point, and analytically estimates yield.
The Importance Sampling (IS) variant draws samples from a distribution that
has a WCD point as mean.
Solido HSMC
HSMC draws (e.g. 5 billion) Monte Carlo samples, and orders them according
to a prediction model, then simulates in that order, from the tail inwards.
The prediction model is built from a small set of "well-spread" pilot
simulations, and is updated as more simulations come in over time.
> ... for high sigma analyses, a 5 billion sample HSMC run can be expected
> to be far less accurate than WCD ...
>
> ... sampling error is often larger than the non-linearity error even for
> very large sample size ...
>
> ... So, while there is a non-linearity error of WCD in Fig. 2, it is still
> a lot smaller than the sampling error of a 5 billion sample MC run.
>
> - Michael Pronath of MunEDA
> http://deepchip.com/items/0531-06.html
I appreciate the interest Michael Pronath has shown in our Solido HSMC.
However, the whole thesis of his post hinged on a false assumption that HSMC
worked only up to 5 billion Monte Carlo samples -- and how that would create
problems at the 6.5 sigma corner case. His assumption was dated.
When we initially introduced Solido HSMC in 2011, it was targeted to quickly
and accurately do Monte Carlo analysis out to 6.0 sigma, for which 5 billion
Monte Carlo samples gives sufficient precision (we asked our users).
As Solido HSMC's usage grew, a few of our "pushing the boundary" users asked
that HSMC be able to handle up to 6.5 sigma. Which's actually a fairly rare
case -- only for people building very large memory arrays.
Nonetheless, we responded accordingly: with Solido Variation Designer 3.0.
Our HSMC can now handle 212 billion Monte Carlo samples, to handle 6.5 sigma
analysis (to +/-0.1 sigma precision).
Michael dedicated so much effort to the trying to find flaws in HSMC on one
particular type of bitcell problem with 5 billion samples (which I have now
addressed), that he failed to address the very real issues that I had
previously raised about WCD. These are:
1. WCD assumes yield can be based on analysis around a single WCD
point; and will fail if this is not the case. Most WCD
implementations assume that the WCD point can be found by way
of local optimization; and will fail if local optimization does
not find the global optimum. Ensuring global optimality is
exponentially expensive in circuit size. This means WCD has
issues in accuracy, speed, and scalability.
2. When WCD fails, the user has no way to tell. The "theories" to
bound error do not work in practice. There is no verifiability.
Furthermore, high-sigma analysis is needed on more than just bitcells. Other
types of circuits can have very different characteristics.
Below, I show how WCD fails on bitcell and sense amp examples, backed up by
hard data. I also give a memory column example. For the sake of clarity,
I will frame the discussion in terms of criteria that customers have told us
matter most. I will directly compare Solido HSMC with WCD versus WCD-style
Importance Sampling (WCD/IS).
High-Sigma Criteria:
1. Speed: runs in reasonable time.
2. Accuracy: returns correct estimate of yield (given target
spec), or spec (given target yield), or whole tail of output.
3. Scalability: handles larger numbers of devices and process
variables, according to user needs. Some circuits have
over 10,000 process variables.
4. Verifiability: answers "can I trust it?" and "if it fails,
can I tell?".
These criteria apply to all circuits of interest: not only on bitcells, but
also other memory cells like: sense amps, memory columns, digital standard
cells like flip flops, and even analog circuits.
These factors interact. For example a single flip-flop may have 180 process
variables, posing a scalability problem. And memory columns can have over
10,000 variables.
1. SPEED
WCD and IS typically require a moderate number of simulations. The first
step typically runs a local optimizer, or perturbation analysis. In the
second step, WCD either takes no simulations or does perturbation analysis,
and IS typically takes 1000 to 10,000 simulations.
Solido HSMC gets its speed by focusing simulations on tail Monte Carlo
samples. Runtime is typically minutes to hours, depending on circuit size,
circuit simulation time, target sigma, and number of cores. This runtime
includes handling billions of Monte Carlo samples.
2. ACCURACY
WCD and IS assume that yield can be based on analysis around a single WCD
point. WCD and IS assume that there is a single failure region.
Furthermore, typical WCD/IS approaches assume that the WCD point can be
found via local optimization -- if the optimization gets stuck in a local
optima then it will over-estimate yield. Or, if global optimization is
used, then runtime becomes extremely long. WCD and IS assume that when
there is more than one output, that failure regions do not overlap. These
assumptions may hold for some bitcell problems, but have no guarantee for
all bitcell problems, let alone sense amps, memory columns, flip flops,
multiplexers, and so on. (I'll elaborate on WCD/IS accuracy issues later).
Solido HSMC gets its accuracy by simulating Monte Carlo tail samples, and
avoiding dangerous assumptions when choosing which tail samples to simulate.
Unlike WCD and IS, Solido HSMC does NOT assume there is a single failure
region. It does NOT assume that failure rate can be based on analysis
around a single WCD point. When there are multiple outputs, Solido HSMC
naturally accounts for overlapping failure regions. It accounts for an
imperfect sorting model. It uses SPICE simulations on all tail samples.
Solido HSMC can do 212 billion samples, which gives +/- 0.1 sigma precision
for up to 6.5 sigma.
3. SCALABILITY
WCD/IS: the first step of WCD/IS is finding the WCD point. If a local
optimizer like SQP is used, then that step is moderately scalable.
However, as I mentioned before, it may get stuck in a local optima. A fully
reliable global optimizer scales poorly -- because it's exponential in the
number of variables.
The second step of WCD/IS is estimating yield about the WCD point. It is
scalable if using WCD with linear boundary assumption, or if your IS with
uncorrelated sampling -- but is less scalable if using a WCD with quadratic
boundary, or your IS is with correlated sampling.
Solido HSMC is scalable because its two core components are scalable. Our
Monte Carlo sampling is independent of dimensionality, and its sorting model
is based on machine learning technology used on 1 M+ input dimensions.
HSMC is now routinely applied to industrial problems with 10,000+ variables,
such as memory columns.
4. VERIFIABILITY
> ... Importance Sampling enables unbiased estimators, bounding the variance
> and estimating errors.
>
> - Michael Pronath of MunEDA
This is an intuitively appealing theory -- that because a fraction of the
samples are drawn from the true distribution -- rather than the sampling
distribution, the yield estimate will be bounded. Unfortunately for MunEDA,
this is one of those places where theory differs considerably from practice.
To get an upper bound yield estimate from the true distribution that is
under 100% (sigma=inf) then one needs at least one failure from the true
distribution's samples.
If the mixture IS uses true Monte Carlo samples 10% of the time, then on a
6 sigma circuit, on average it would need 10 billion simulations (!) before
the true distribution would have any on upper bound.
The main aspect of Solido HSMC's verifiability is its convergence curve of
output versus sample.
Fig 1: Screenshot from Solido Variation Design GUI.
(click on pic to enlarge)
The top builds intuition -- and the bottom allows analysis between quantile
and output. Both images show each simulated sample. A right click on a
sample gives the option to see waveforms, simulation logs, and more. Both
top and bottom also show the estimated density curve, which is clearly
non-Gaussian; in this case, a long tail.
---- ---- ---- ---- ---- ----
Next, I would also like to respond in-depth to MunEDA's comments on Solido's
High Sigma Monte Carlo (HSMC) versus MunEDA's Worst Case Distances (WCD).
For the benefit of those just entering this thread, I will quickly define
each technique.
Worst Case Distances (WCD) and Importance Sampling (IS)
Both first find the process point (WCD point) that has highest probability
of failure, typically using a local optimizer like sequential quadratic
programming (SQP). Then WCD typically assumes a linear feasibility boundary
around that WCD point, and analytically estimates yield.
The Importance Sampling (IS) variant draws samples from a distribution that
has a WCD point as mean.
Solido HSMC
HSMC draws (e.g. 5 billion) Monte Carlo samples, and orders them according
to a prediction model, then simulates in that order, from the tail inwards.
The prediction model is built from a small set of "well-spread" pilot
simulations, and is updated as more simulations come in over time.
> ... for high sigma analyses, a 5 billion sample HSMC run can be expected
> to be far less accurate than WCD ...
>
> ... sampling error is often larger than the non-linearity error even for
> very large sample size ...
>
> ... So, while there is a non-linearity error of WCD in Fig. 2, it is still
> a lot smaller than the sampling error of a 5 billion sample MC run.
>
> - Michael Pronath of MunEDA
> http://deepchip.com/items/0531-06.html
I appreciate the interest Michael Pronath has shown in our Solido HSMC.
However, the whole thesis of his post hinged on a false assumption that HSMC
worked only up to 5 billion Monte Carlo samples -- and how that would create
problems at the 6.5 sigma corner case. His assumption was dated.
When we initially introduced Solido HSMC in 2011, it was targeted to quickly
and accurately do Monte Carlo analysis out to 6.0 sigma, for which 5 billion
Monte Carlo samples gives sufficient precision (we asked our users).
As Solido HSMC's usage grew, a few of our "pushing the boundary" users asked
that HSMC be able to handle up to 6.5 sigma. Which's actually a fairly rare
case -- only for people building very large memory arrays.
Nonetheless, we responded accordingly: with Solido Variation Designer 3.0.
Our HSMC can now handle 212 billion Monte Carlo samples, to handle 6.5 sigma
analysis (to +/-0.1 sigma precision).
Michael dedicated so much effort to the trying to find flaws in HSMC on one
particular type of bitcell problem with 5 billion samples (which I have now
addressed), that he failed to address the very real issues that I had
previously raised about WCD. These are:
1. WCD assumes yield can be based on analysis around a single WCD
point; and will fail if this is not the case. Most WCD
implementations assume that the WCD point can be found by way
of local optimization; and will fail if local optimization does
not find the global optimum. Ensuring global optimality is
exponentially expensive in circuit size. This means WCD has
issues in accuracy, speed, and scalability.
2. When WCD fails, the user has no way to tell. The "theories" to
bound error do not work in practice. There is no verifiability.
Furthermore, high-sigma analysis is needed on more than just bitcells. Other
types of circuits can have very different characteristics.
Below, I show how WCD fails on bitcell and sense amp examples, backed up by
hard data. I also give a memory column example. For the sake of clarity,
I will frame the discussion in terms of criteria that customers have told us
matter most. I will directly compare Solido HSMC with WCD versus WCD-style
Importance Sampling (WCD/IS).
High-Sigma Criteria:
1. Speed: runs in reasonable time.
2. Accuracy: returns correct estimate of yield (given target
spec), or spec (given target yield), or whole tail of output.
3. Scalability: handles larger numbers of devices and process
variables, according to user needs. Some circuits have
over 10,000 process variables.
4. Verifiability: answers "can I trust it?" and "if it fails,
can I tell?".
These criteria apply to all circuits of interest: not only on bitcells, but
also other memory cells like: sense amps, memory columns, digital standard
cells like flip flops, and even analog circuits.
These factors interact. For example a single flip-flop may have 180 process
variables, posing a scalability problem. And memory columns can have over
10,000 variables.
1. SPEED
WCD and IS typically require a moderate number of simulations. The first
step typically runs a local optimizer, or perturbation analysis. In the
second step, WCD either takes no simulations or does perturbation analysis,
and IS typically takes 1000 to 10,000 simulations.
Solido HSMC gets its speed by focusing simulations on tail Monte Carlo
samples. Runtime is typically minutes to hours, depending on circuit size,
circuit simulation time, target sigma, and number of cores. This runtime
includes handling billions of Monte Carlo samples.
2. ACCURACY
WCD and IS assume that yield can be based on analysis around a single WCD
point. WCD and IS assume that there is a single failure region.
Furthermore, typical WCD/IS approaches assume that the WCD point can be
found via local optimization -- if the optimization gets stuck in a local
optima then it will over-estimate yield. Or, if global optimization is
used, then runtime becomes extremely long. WCD and IS assume that when
there is more than one output, that failure regions do not overlap. These
assumptions may hold for some bitcell problems, but have no guarantee for
all bitcell problems, let alone sense amps, memory columns, flip flops,
multiplexers, and so on. (I'll elaborate on WCD/IS accuracy issues later).
Solido HSMC gets its accuracy by simulating Monte Carlo tail samples, and
avoiding dangerous assumptions when choosing which tail samples to simulate.
Unlike WCD and IS, Solido HSMC does NOT assume there is a single failure
region. It does NOT assume that failure rate can be based on analysis
around a single WCD point. When there are multiple outputs, Solido HSMC
naturally accounts for overlapping failure regions. It accounts for an
imperfect sorting model. It uses SPICE simulations on all tail samples.
Solido HSMC can do 212 billion samples, which gives +/- 0.1 sigma precision
for up to 6.5 sigma.
3. SCALABILITY
WCD/IS: the first step of WCD/IS is finding the WCD point. If a local
optimizer like SQP is used, then that step is moderately scalable.
However, as I mentioned before, it may get stuck in a local optima. A fully
reliable global optimizer scales poorly -- because it's exponential in the
number of variables.
The second step of WCD/IS is estimating yield about the WCD point. It is
scalable if using WCD with linear boundary assumption, or if your IS with
uncorrelated sampling -- but is less scalable if using a WCD with quadratic
boundary, or your IS is with correlated sampling.
Solido HSMC is scalable because its two core components are scalable. Our
Monte Carlo sampling is independent of dimensionality, and its sorting model
is based on machine learning technology used on 1 M+ input dimensions.
HSMC is now routinely applied to industrial problems with 10,000+ variables,
such as memory columns.
4. VERIFIABILITY
> ... Importance Sampling enables unbiased estimators, bounding the variance
> and estimating errors.
>
> - Michael Pronath of MunEDA
This is an intuitively appealing theory -- that because a fraction of the
samples are drawn from the true distribution -- rather than the sampling
distribution, the yield estimate will be bounded. Unfortunately for MunEDA,
this is one of those places where theory differs considerably from practice.
To get an upper bound yield estimate from the true distribution that is
under 100% (sigma=inf) then one needs at least one failure from the true
distribution's samples.
If the mixture IS uses true Monte Carlo samples 10% of the time, then on a
6 sigma circuit, on average it would need 10 billion simulations (!) before
the true distribution would have any on upper bound.
The main aspect of Solido HSMC's verifiability is its convergence curve of
output versus sample.
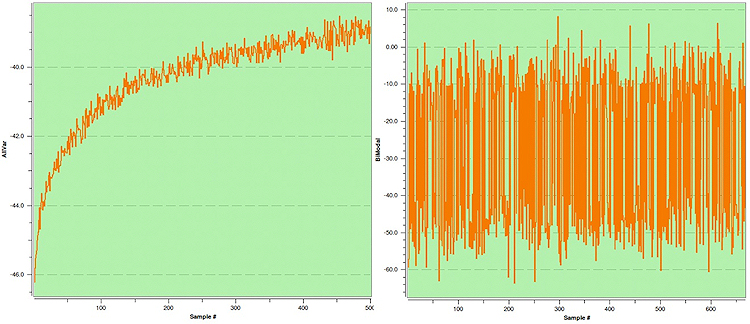 Fig 2: Solido HSMC "output versus sample number" convergence curves
providing user verifiability. (click pic to enlarge.)
If there's a trend, then HSMC is working well (see figure 2 left). If there
is not a trend (figure 2 right), something's up, and the most common action
is to investigate issues in testbench/output measure setup. This is akin to
SPICE reporting the degree to which it has solved KCL.
---- ---- ---- ---- ---- ----
CIRCUITS OF INTEREST
WCD/IS - Michael focused solely on bitcells -- but below and elsewhere in my
post here are demonstrations of how WCD and IS can do poorly on bitcells.
Beyond bitcells, in Solido's internal tests, WCD and IS performed poorly on
sense amp delay, flip-flop drain current, and other circuit problems. Later
I'll show in detail a sense amp example where WCD fails.
Solido HSMC - continues to be successfully applied to bitcells, sense amps,
memory columns/arrays, delay buffers, flip flops, multiplexers, oscillators,
opamps, and other memory cells, digital standard cells, and analog circuits.
---- ---- ---- ---- ---- ----
Let's explore the accuracy issues of WCD and (WCD-based) IS more closely.
WCD/IS Assumption: yield can be based on analysis around a single WCD point.
> ...single-sided with curvature are the relevant case for bit cells...
> ...Solido doesn't do the math about [WCD] error figures ...
>
> - Michael Pronath of MunEDA
> http://www.deepchip.com/items/0531-06.html
Let me quantify the potential error magnitude. Even in the case of "single-
sided with curvature are the relevant case for bit cells", WCD and (WCD-
based) IS can be inaccurate.
Below in figure 3 is an example on bitcell read current, from Sun et al.
Fig 2: Solido HSMC "output versus sample number" convergence curves
providing user verifiability. (click pic to enlarge.)
If there's a trend, then HSMC is working well (see figure 2 left). If there
is not a trend (figure 2 right), something's up, and the most common action
is to investigate issues in testbench/output measure setup. This is akin to
SPICE reporting the degree to which it has solved KCL.
---- ---- ---- ---- ---- ----
CIRCUITS OF INTEREST
WCD/IS - Michael focused solely on bitcells -- but below and elsewhere in my
post here are demonstrations of how WCD and IS can do poorly on bitcells.
Beyond bitcells, in Solido's internal tests, WCD and IS performed poorly on
sense amp delay, flip-flop drain current, and other circuit problems. Later
I'll show in detail a sense amp example where WCD fails.
Solido HSMC - continues to be successfully applied to bitcells, sense amps,
memory columns/arrays, delay buffers, flip flops, multiplexers, oscillators,
opamps, and other memory cells, digital standard cells, and analog circuits.
---- ---- ---- ---- ---- ----
Let's explore the accuracy issues of WCD and (WCD-based) IS more closely.
WCD/IS Assumption: yield can be based on analysis around a single WCD point.
> ...single-sided with curvature are the relevant case for bit cells...
> ...Solido doesn't do the math about [WCD] error figures ...
>
> - Michael Pronath of MunEDA
> http://www.deepchip.com/items/0531-06.html
Let me quantify the potential error magnitude. Even in the case of "single-
sided with curvature are the relevant case for bit cells", WCD and (WCD-
based) IS can be inaccurate.
Below in figure 3 is an example on bitcell read current, from Sun et al.
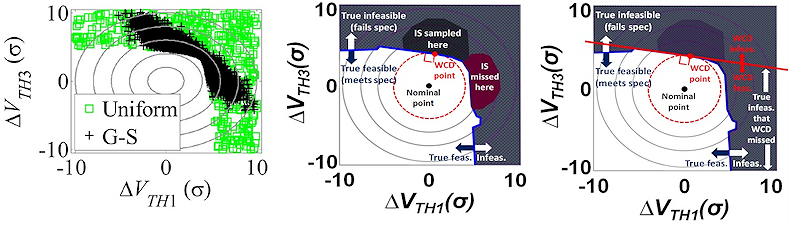 Fig 3: Inaccuracy of WCD/IS. Left -- SRAM delta bit voltage
feasibility vs. statistical variables. Middle -- IS
algorithm behavior on SRAM feasibility boundary.
Right -- WCD algorithm on SRAM feasibility boundary.
Left is from: S. Sun et al., "Efficient SRAM failure
rate prediction via Gibbs sampling," IEEE TCAD 31(12),
Dec. 2012, Fig. 13b. (click pic to enlarge.)
On the left, infeasible points are black or green. The black points are
importance samples (IS). The middle plot shows the same data, with clearer
labels, emphasizing where IS sampled and did not sample. The failure region
to the right is nearly as probable as the failure region at the top.
As Sun et al state, "[the IS sampler] only draws random samples from a small
portion of the high probability failure region, thereby underestimating the
failure probability." It "fails to work, since the high-probability failure
region corresponds to an irregular, nonconvex shape".
By missing the region to the right, IS underestimated failure rate by 44.7%.
WCD with a linear feasibility boundary fails for similar reasons (right).
Underestimation of failure rate actually approaches 2X as nominal and right
failure region get closer, by way of slightly different nominal Vths, Vdds,
capacitances, loads, etc.
Furthermore, in a real problem with more than 2 dimensions, there would have
been no way to tell that IS/WCD had failed, i.e. it is not verifiable here.
---- ---- ---- ---- ---- ----
WCD/IS assumption: your WCD point can be found via local optimization
This can easily happen, in practice, where the steepest slope at nominal
points to a different direction than the true worst-case and leads the
optimizer to a local optimum. Solido sees this in things like sense amp
delay, column analysis, and many standard cells -- where the failure happens
at a sharp slope or discontinuity.
Below (figure 4) is an example on sense amp delay. Of the sense amp's 150
process variables, two variables have by far the biggest effect on delay
when they interact. They are plotted below, with delay in the z-axis.
Fig 3: Inaccuracy of WCD/IS. Left -- SRAM delta bit voltage
feasibility vs. statistical variables. Middle -- IS
algorithm behavior on SRAM feasibility boundary.
Right -- WCD algorithm on SRAM feasibility boundary.
Left is from: S. Sun et al., "Efficient SRAM failure
rate prediction via Gibbs sampling," IEEE TCAD 31(12),
Dec. 2012, Fig. 13b. (click pic to enlarge.)
On the left, infeasible points are black or green. The black points are
importance samples (IS). The middle plot shows the same data, with clearer
labels, emphasizing where IS sampled and did not sample. The failure region
to the right is nearly as probable as the failure region at the top.
As Sun et al state, "[the IS sampler] only draws random samples from a small
portion of the high probability failure region, thereby underestimating the
failure probability." It "fails to work, since the high-probability failure
region corresponds to an irregular, nonconvex shape".
By missing the region to the right, IS underestimated failure rate by 44.7%.
WCD with a linear feasibility boundary fails for similar reasons (right).
Underestimation of failure rate actually approaches 2X as nominal and right
failure region get closer, by way of slightly different nominal Vths, Vdds,
capacitances, loads, etc.
Furthermore, in a real problem with more than 2 dimensions, there would have
been no way to tell that IS/WCD had failed, i.e. it is not verifiable here.
---- ---- ---- ---- ---- ----
WCD/IS assumption: your WCD point can be found via local optimization
This can easily happen, in practice, where the steepest slope at nominal
points to a different direction than the true worst-case and leads the
optimizer to a local optimum. Solido sees this in things like sense amp
delay, column analysis, and many standard cells -- where the failure happens
at a sharp slope or discontinuity.
Below (figure 4) is an example on sense amp delay. Of the sense amp's 150
process variables, two variables have by far the biggest effect on delay
when they interact. They are plotted below, with delay in the z-axis.
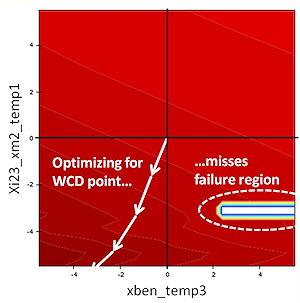 Fig 4: Contour plot of sense amp delay, as a function of the
two highest-impacting process variables. Local optimization
based-WCD will follow the gradient to the bottom left corner,
and miss the feasibility region.
Note how the slope from nominal points to the bottom left; this is where the
WCD/IS optimizer would go. However, the actual failure region is in the
bottom right, where a sharp discontinuity dramatically changes delay.
The WCD/IS optimizer chooses a WCD point far out to the bottom left, which
in turn causes a gross overestimate of yield. Not only is the yield wrong,
there would have been no way to tell that IS/WCD had failed.
In contrast, Solido HSMC handles such circuits without any issues. Below
(figure 5) is an example NQ plot on sense amp delay.
Fig 4: Contour plot of sense amp delay, as a function of the
two highest-impacting process variables. Local optimization
based-WCD will follow the gradient to the bottom left corner,
and miss the feasibility region.
Note how the slope from nominal points to the bottom left; this is where the
WCD/IS optimizer would go. However, the actual failure region is in the
bottom right, where a sharp discontinuity dramatically changes delay.
The WCD/IS optimizer chooses a WCD point far out to the bottom left, which
in turn causes a gross overestimate of yield. Not only is the yield wrong,
there would have been no way to tell that IS/WCD had failed.
In contrast, Solido HSMC handles such circuits without any issues. Below
(figure 5) is an example NQ plot on sense amp delay.
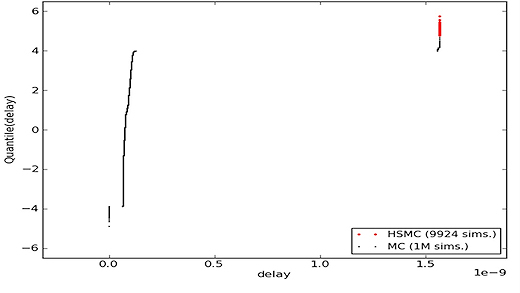 Fig 5: Normal quantile plot of sense amp delay, illustrating
Solido HSMC successfully finding the tail (red, top right).
It compares 1 M simulated Monte Carlo samples (black dots) to Solido HSMC
tail samples from 100 M generated Monte Carlo samples (red dots). Note the
discontinuity in delay from 0.2 to 1.6 nsec. Running all 150 variables,
Solido HSMC easily found the region with 1.6 nsec delay, as illustrated by
the red dots in the image.
---- ---- ---- ---- ---- ----
In a 2nd example of the Solido HSMC ability to handle discontinuities, below
in figure 6 is an example NQ plot for the upper tail on a memory column.
Fig 5: Normal quantile plot of sense amp delay, illustrating
Solido HSMC successfully finding the tail (red, top right).
It compares 1 M simulated Monte Carlo samples (black dots) to Solido HSMC
tail samples from 100 M generated Monte Carlo samples (red dots). Note the
discontinuity in delay from 0.2 to 1.6 nsec. Running all 150 variables,
Solido HSMC easily found the region with 1.6 nsec delay, as illustrated by
the red dots in the image.
---- ---- ---- ---- ---- ----
In a 2nd example of the Solido HSMC ability to handle discontinuities, below
in figure 6 is an example NQ plot for the upper tail on a memory column.
 Fig 6: Normal quantile plot from Solido Variation Designer GUI
of memory column "vq" output, illustrating Solido HSMC
successfully finding the tail. (top right)
(click pic to enlarge.)
The column has 14 global and 560 local process variables. The "vq" output
is 0.0 V (logical 0) if the READ is successful, and 0.8 V (logical 1) if
otherwise -- making it discontinuous by definition. A local optimizer like
SQP (typically in WCD) would not have been able to find the failure region.
Of the 100 M Monte Carlo samples analyzed, 21 failed spec, giving 5.06 sigma
[4.97 sigma to 5.14 sigma].
"A million dollars isn't cool.
You know what's cool? A billion dollars."
- Justin Timberlake, as character Sean Parker,
in The Social Network (2010)
We could say the same for Monte Carlo samples. Being able to run a million
Monte Carlo samples can considerably enrich a user's life. A billion?
That's cool. Solido High-Sigma Monte Carlo (HSMC) currently handles
*212 billion* Monte Carlo samples (good for 6.5 sigma), needing only a few
thousand simulations.
- Trent McConaghy
Solido Design Somewhere, Canada
Fig 6: Normal quantile plot from Solido Variation Designer GUI
of memory column "vq" output, illustrating Solido HSMC
successfully finding the tail. (top right)
(click pic to enlarge.)
The column has 14 global and 560 local process variables. The "vq" output
is 0.0 V (logical 0) if the READ is successful, and 0.8 V (logical 1) if
otherwise -- making it discontinuous by definition. A local optimizer like
SQP (typically in WCD) would not have been able to find the failure region.
Of the 100 M Monte Carlo samples analyzed, 21 failed spec, giving 5.06 sigma
[4.97 sigma to 5.14 sigma].
"A million dollars isn't cool.
You know what's cool? A billion dollars."
- Justin Timberlake, as character Sean Parker,
in The Social Network (2010)
We could say the same for Monte Carlo samples. Being able to run a million
Monte Carlo samples can considerably enrich a user's life. A billion?
That's cool. Solido High-Sigma Monte Carlo (HSMC) currently handles
*212 billion* Monte Carlo samples (good for 6.5 sigma), needing only a few
thousand simulations.
- Trent McConaghy
Solido Design Somewhere, Canada
Join
Index
Next->Item
|
|