( ESNUG 541 Item 7 ) -------------------------------------------- [05/23/14]
Subject: CDNS R&D responds to user "bad experiences" with Cadence ADE-XL
> Because of bad experiences we had with Cadence ADE-XL variation analysis:
>
> - ADE-XL doesn't let us pick different distributions.
>
> - Sensitivity analysis in ADE-XL 6.1 doesn't work as it produces
> illogical answers. E.g. it told us that our offset variation
> was due to a digital line that didn't even change during the
> variation. That's crazy.
>
> We evaled and bought Solido first for 3-sigma Monte Carlo and then later
> for 4- and 6-sigma HSMC.
>
> - [ Mr. Magoo ]
> http://www.deepchip.com/items/0538-09.html
From: [ Vuk Borich of Cadence ]
Hi, John,
As the Engineering Director of the Cadence ADE Team, I'd like to correct
some of the statements [ Mr. Magoo ] has made.
Some of the updates that I'll introduce are new stuff and some of them will
be released in a couple of months.
So, let's clear up some misperceptions:
"ADE-XL doesn't let us pick different distributions."
UPDATE: We are not exactly sure what Mr M means here. We depend on the
foundries to place appropriate distributions on parameters within the PDK's
and model files. Their process engineers know best in terms of the
mathematics required to model device behavior.
But Mr M may have meant setting simulator modes which do affect the speed
and accuracy of the sampling. Mr M referenced Latin-hypercube, but that
has limitations. We have replaced that method with a new Low-Discrepancy
Sampling method which has the advantage of exploring the design space
evenly and of being able to take advantage of the auto-stop feature within
ADE-XL once yield targets are met.
Or, he may have meant having the ability to set particular distributions
when plotting. Changes we have made that he may be unfamiliar with:
- In IC61, to improve interactivity of ADE-XL, the ability to
directly plot a distribution from the Monte Carlo results was
provided, RMB on the specification and plot histogram.
- The traditional ADE use model was to allow the designer to
plot multiple distributions. This functionality continues
to be supported. The user needs to select plot histograms
from the icon on the top of the ADE-XL Results window.
- In IC616, users are allowed to plot quantile plots (Q-Q plot)
for any histogram as well.
---- ---- ---- ---- ---- ---- ----
> The initial display is horrible. ADE-XL displays every device and gives
> you a color to indicate results, not a correlation coefficient. Color
> just doesn't do it. Plus each device has a little tiny infinitesimal
> graph with a slope and you must compare those to figure it out. You
> must then find the pull-down to get correlation coefficient between 0
> and 1 -- it's not the default. Plus you need a ADE-GXL license for it!
UPDATE: We agree that the default display in the older version Mr. M is
using leaves something to be desired. So, in our latest version, we now
display contribution margin which makes it very obvious which device
is causing the most variance-per-measurement inside ADE XL.
---- ---- ---- ---- ---- ---- ----
> I can tell you horror stories. Cadence ADE-XL uses Latin Hypercube and
> WCD. I was trying to see if we had a 3-sigma problem, i.e. 1 failure
> in 1000. I ran 100 simulations using Cadence ADE-XL with Spectre and
> got a failure. I wasted DAYS on that one corner Cadence identified,
> and it turns out it only had a 1 in 7 billion chance of error. That's
> the lifetime of the universe!
UPDATE: Mr Magoo was unable to provide a test case for this, but we remain
confident in the algorithms we use based upon other customer experiences.
When your Monte Carlo analysis shows device mismatch variation has become
problematic, Virtuoso GXL Mismatch Contribution Analysis can provide some
useful diagnostics as a next step. Mismatch Contribution helps in find the
most important contributors to the variance of your outputs. You can also
compare the relative importance of the contributing instances.
It does variance-based global sensitivity analysis.
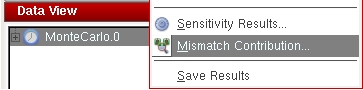
Mismatch Contribution is launched from Monte Carlo results:
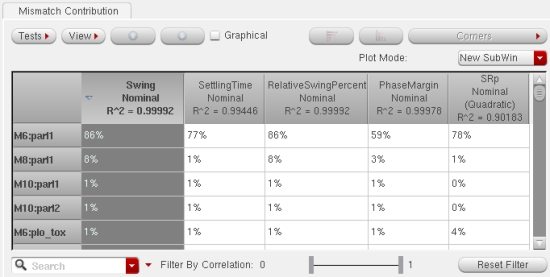
 Here is a flat view of your outputs, and mismatch parameters are displayed
and sorted by the swing specification:
Here is a flat view of your outputs, and mismatch parameters are displayed
and sorted by the swing specification:
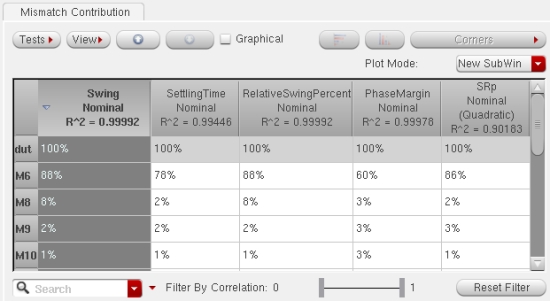
 Each device instance may be modeled with multiple statistical mismatch
parameters. The parameter names themselves are not always of interest. In
some cases the PDK models are derived from principal components. Mismatch
Contribution provides a hierarchical view where the total contribution of
all of the device parameters is displayed for each instance. This view
reports the contributions by instance for quick identification of important
instances.
Each device instance may be modeled with multiple statistical mismatch
parameters. The parameter names themselves are not always of interest. In
some cases the PDK models are derived from principal components. Mismatch
Contribution provides a hierarchical view where the total contribution of
all of the device parameters is displayed for each instance. This view
reports the contributions by instance for quick identification of important
instances.
 Cross probing to the schematic is provided. The schematic is opened to the
same level of hierarchy, and then the selected instances are highlighted.
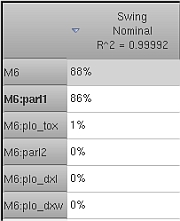
Navigate the table as you would a schematic. Descend into a row (instance)
of the table until reaching the leaf level. The leaf level again displays
the individual mismatch parameters of the instance.
Cross probing to the schematic is provided. The schematic is opened to the
same level of hierarchy, and then the selected instances are highlighted.
Navigate the table as you would a schematic. Descend into a row (instance)
of the table until reaching the leaf level. The leaf level again displays
the individual mismatch parameters of the instance.
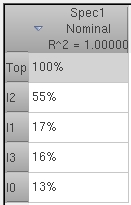
 By contrast, a top-level view with four blocks shows the block contributing
the most variation of the specification. Descend to find the lower-level
contributors.
By contrast, a top-level view with four blocks shows the block contributing
the most variation of the specification. Descend to find the lower-level
contributors.
 When global process variation is applied during Monte Carlo analysis, the
effects of the process parameters are included in the contribution analysis.
Mismatch Contribution is not limited to linear effects. When a linear model
of your data is insufficient, a quadratic model is automatically applied.
The R^2 value in the header of the table for each specification is the
proportion of variance explained by the model. This is the goodness of fit
of the model. Sparse regression techniques allow for computation of the
contributions even when the number of parameters is very large compared to
the number of Monte Carlo samples simulated. Mismatch Contribution is
available now in Virtuoso ADE GXL, first released in IC6.1.6 ISR3.
Lastly, we did an overhaul of our histogram displays. Now the histograms
display the individual points showing the outliers from the Monte Carlo run.
You can select an outlier and cross probe to the ADE XL Detail view. From
there you can see the exact state of all the device parameters for that
outlier or create a statistical corner allowing you to optimize your design
with these corners to improve yield. The histograms also now display pass-
fail regions and correlation coefficients are easily available.
---- ---- ---- ---- ---- ---- ----
> Cadence ADE-XL with Spectre does have some Monte Carlo results reporting,
> but some of its reporting is crude. It's slower because it requires more
> SPICE runs than Solido for 3-sigma (per numbers above).
UPDATE: In IC6.1.6 ISR6 (April 25 release), we are introducing the ability
to create "fast" 3-sigma corners. Tested and signed off by major Cadence
customers, we believe this will bring new performance levels to the
industry in this interesting space.
The ADE-XL Monte Carlo sampling methods are Random, Latin Hypercube, and
Low Discrepancy Sequence. More accurately, Spectre provides the engine
and ADE-XL interfaces with the simulator to complete the Monte Carlo
analysis. Random is the standard random sampling method. Latin Hypercube
(LHS) is an enhanced method that converges faster. Low Discrepancy
Sequence (LDS) is the most recently developed method.
Experimental results that compare these three methods:
When global process variation is applied during Monte Carlo analysis, the
effects of the process parameters are included in the contribution analysis.
Mismatch Contribution is not limited to linear effects. When a linear model
of your data is insufficient, a quadratic model is automatically applied.
The R^2 value in the header of the table for each specification is the
proportion of variance explained by the model. This is the goodness of fit
of the model. Sparse regression techniques allow for computation of the
contributions even when the number of parameters is very large compared to
the number of Monte Carlo samples simulated. Mismatch Contribution is
available now in Virtuoso ADE GXL, first released in IC6.1.6 ISR3.
Lastly, we did an overhaul of our histogram displays. Now the histograms
display the individual points showing the outliers from the Monte Carlo run.
You can select an outlier and cross probe to the ADE XL Detail view. From
there you can see the exact state of all the device parameters for that
outlier or create a statistical corner allowing you to optimize your design
with these corners to improve yield. The histograms also now display pass-
fail regions and correlation coefficients are easily available.
---- ---- ---- ---- ---- ---- ----
> Cadence ADE-XL with Spectre does have some Monte Carlo results reporting,
> but some of its reporting is crude. It's slower because it requires more
> SPICE runs than Solido for 3-sigma (per numbers above).
UPDATE: In IC6.1.6 ISR6 (April 25 release), we are introducing the ability
to create "fast" 3-sigma corners. Tested and signed off by major Cadence
customers, we believe this will bring new performance levels to the
industry in this interesting space.
The ADE-XL Monte Carlo sampling methods are Random, Latin Hypercube, and
Low Discrepancy Sequence. More accurately, Spectre provides the engine
and ADE-XL interfaces with the simulator to complete the Monte Carlo
analysis. Random is the standard random sampling method. Latin Hypercube
(LHS) is an enhanced method that converges faster. Low Discrepancy
Sequence (LDS) is the most recently developed method.
Experimental results that compare these three methods:
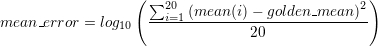
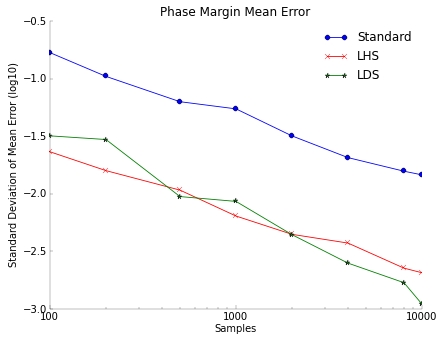 An op amp phase margin is measured with mean error vs. golden result of
100 K Monte Carlo samples. Each data point represents the result of 20
independent trials. The mean error is:
An op amp phase margin is measured with mean error vs. golden result of
100 K Monte Carlo samples. Each data point represents the result of 20
independent trials. The mean error is:
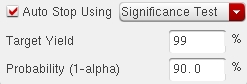
 This is only one example, but in general, LHS and LDS results are found to
be comparable. An advantage of LDS over LHS is that it is compatible with
the ADE-XL feature to automatically stop the Monte Carlo run given a yield
estimate target. If you provide a yield target, your Monte Carlo will stop
performing simulations when the design is either found to exceed the target
or found to be low yield. This saves time by not running any more SPICE
runs than necessary based on the specified significance level. If needed
you can loosen the significance level to get results faster or increase
the level depending on your requirements.
This is only one example, but in general, LHS and LDS results are found to
be comparable. An advantage of LDS over LHS is that it is compatible with
the ADE-XL feature to automatically stop the Monte Carlo run given a yield
estimate target. If you provide a yield target, your Monte Carlo will stop
performing simulations when the design is either found to exceed the target
or found to be low yield. This saves time by not running any more SPICE
runs than necessary based on the specified significance level. If needed
you can loosen the significance level to get results faster or increase
the level depending on your requirements.
 Once your Monte Carlo results are available, statistical corners can be
created. In ADE-XL you can create a statistical corner from any of the
simulated samples. The options to create the corner are: selecting a
point on the histogram, creating a corner out of the worst sample, or by
percentile.
ADE-XL saves only the relevant information such as seed, sequence number,
sampling method, etc. with the corner. Spectre can then recreate the
statistical parameter values for the corner from this information. This
type of corner is efficient and does not require that all the statistical
parameter data for each sample is saved in Monte Carlo.
The downside is that some changes to the design topology such as the
addition of a new instance to the schematic can invalidate the corner.
The simulator can no longer recreate the same set of statistical parameter
values when simulating the statistical corner.
Two types of statistical corners are possible in ADE-XL with version
IC6.1.6 ISR6: a corner with the sequence info saved, or a corner that
contains all of the statistical parameter values. The values-based
corner is more robust in the face of these minor design changes. The
new instance added to the design does not invalidate the existing
statistical corner of this type. The user can choose which corner type
better suits their needs.
---- ---- ---- ---- ---- ---- ----
All of the above methods define the corner by one of the simulated Monte
Carlo samples. To create a 3-sigma statistical corner you must have
simulated a large number of samples. A new ADE-GXL feature to be released
with IC6.1.6 ISR6 addresses this problem. The goal is to create a k-sigma
statistical corner quickly (by default 3 sigma - you can specify the
yield-in-sigma target) without the need to run thousands of simulations.
The fast 3-sigma corner flow is to:
- Run Monte Carlo (only a few hundred samples compared with the
traditional approach requiring 1000+ samples)
- Create the fast 3 sigma statistical corner
A minimum of 1 and a maximum of 11 extra simulations per corner are needed
for this step.
The fast 3-sigma corner algorithm estimates the probability density function
(PDF) of the performance distribution maintaining accuracy for non-normal
distributions. The spec target value is computed from the PDF estimate.
Once your Monte Carlo results are available, statistical corners can be
created. In ADE-XL you can create a statistical corner from any of the
simulated samples. The options to create the corner are: selecting a
point on the histogram, creating a corner out of the worst sample, or by
percentile.
ADE-XL saves only the relevant information such as seed, sequence number,
sampling method, etc. with the corner. Spectre can then recreate the
statistical parameter values for the corner from this information. This
type of corner is efficient and does not require that all the statistical
parameter data for each sample is saved in Monte Carlo.
The downside is that some changes to the design topology such as the
addition of a new instance to the schematic can invalidate the corner.
The simulator can no longer recreate the same set of statistical parameter
values when simulating the statistical corner.
Two types of statistical corners are possible in ADE-XL with version
IC6.1.6 ISR6: a corner with the sequence info saved, or a corner that
contains all of the statistical parameter values. The values-based
corner is more robust in the face of these minor design changes. The
new instance added to the design does not invalidate the existing
statistical corner of this type. The user can choose which corner type
better suits their needs.
---- ---- ---- ---- ---- ---- ----
All of the above methods define the corner by one of the simulated Monte
Carlo samples. To create a 3-sigma statistical corner you must have
simulated a large number of samples. A new ADE-GXL feature to be released
with IC6.1.6 ISR6 addresses this problem. The goal is to create a k-sigma
statistical corner quickly (by default 3 sigma - you can specify the
yield-in-sigma target) without the need to run thousands of simulations.
The fast 3-sigma corner flow is to:
- Run Monte Carlo (only a few hundred samples compared with the
traditional approach requiring 1000+ samples)
- Create the fast 3 sigma statistical corner
A minimum of 1 and a maximum of 11 extra simulations per corner are needed
for this step.
The fast 3-sigma corner algorithm estimates the probability density function
(PDF) of the performance distribution maintaining accuracy for non-normal
distributions. The spec target value is computed from the PDF estimate.
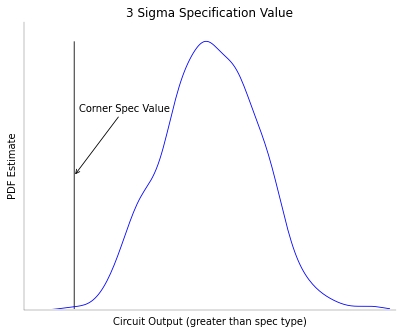 A statistical corner is then created that matches the target spec value.
There can be multiple corners that meet these criteria. This method finds
the most representative corner by minimizing the distance to the nominal
point. This representative corner has a greater probability to occur. Now
the statistical corner can be used for further analysis of the design.
---- ---- ---- ---- ---- ---- ----
Concerning the overall usability issues Mr. Magoo raised about ADE-XL and
ADE-GXL, with each release we take the issue of usability very seriously
and continue to nip, tuck, and revamp forms and flows that cause our
customers confusion.
John, I assure you that every one of our customers (and there are a lot of
them) has an opinion about what is "usability". We see this as really a
never-ending project, particularly when dealing with analyses that are very
complex -- but we will always continue to make strides.
In closing, we welcome spirited dialog with our customers (and competitors).
We have over 375 different logos for ADE-XL and over 150 for ADE-GXL.
My team's priority is to provide the ultimate user experience for all of
the engineers behind all of those logos.
- Vuk Borich
Cadence San Jose, CA
---- ---- ---- ---- ---- ---- ----
Related Articles
Detailed user eval of Cadence ADE-XL, Solido, BDA AFS, Spectre
A statistical corner is then created that matches the target spec value.
There can be multiple corners that meet these criteria. This method finds
the most representative corner by minimizing the distance to the nominal
point. This representative corner has a greater probability to occur. Now
the statistical corner can be used for further analysis of the design.
---- ---- ---- ---- ---- ---- ----
Concerning the overall usability issues Mr. Magoo raised about ADE-XL and
ADE-GXL, with each release we take the issue of usability very seriously
and continue to nip, tuck, and revamp forms and flows that cause our
customers confusion.
John, I assure you that every one of our customers (and there are a lot of
them) has an opinion about what is "usability". We see this as really a
never-ending project, particularly when dealing with analyses that are very
complex -- but we will always continue to make strides.
In closing, we welcome spirited dialog with our customers (and competitors).
We have over 375 different logos for ADE-XL and over 150 for ADE-GXL.
My team's priority is to provide the ultimate user experience for all of
the engineers behind all of those logos.
- Vuk Borich
Cadence San Jose, CA
---- ---- ---- ---- ---- ---- ----
Related Articles
Detailed user eval of Cadence ADE-XL, Solido, BDA AFS, Spectre
Join
Index
Next->Item
|
|