( ESNUG 558 Item 12 ) --------------------------------------------- [03/29/16]

From: [ Igor Keller of Cadence ]
Subject: Cadence R&D warns non-Gaussian distributions haunt below 16/14nm

Hi, John,

We've been doing some in depth investigation on chip process variation here
at Cadence and we found something that your readers should be aware of.

Let me cut right to the chase; for all the statistical modeling that the
EDA industry has been working on (and rolling out various EDA tools and
library formats on -- including LVF) the engineering assumption has always
been that chip delay variation is a normal Gaussian distribution.  This
includes all of the EDA vendors doing STA.

Things just worked so much easier and straightforward, both mathmatically
and in practical engineering terms, when using a nice predictable normal
Gaussian distribution.
But with the new operating models below 16/14nm, especially with low and
ultralow voltage operation, we can no longer ignore the true nature of
variation, which is an abnormal non-Gaussian distribution.
What this means to a chip designer is:
- OCV derates,
- stage based table derates (aka AOCV), and
- even statistical methods like POCV and SOCV
are all broken in terms of accuracy. Hints of this start at 16/14nm and
then become particularly true at 10nm and below. These lower nodes have
two big issues:
- increasing process variation relative to shrinking critical
dimensions of the transistors (like lower gate lengths.)
- the move towards low voltage (0.8 volt) and ultra-low voltage
(below 0.6 volt) operation to save power.
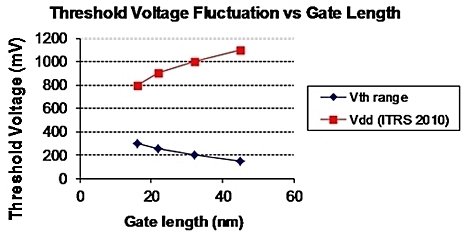
The effects of process variation in these operating regions are exacerbated
because the transistor current is a strong function of threshold voltage Vt,
and delay is a strongly nonlinear function of current.
As Vt fluctuations increase at 10/7/5nm and at the same time Vdd decreases
(in fig above), the switching devices operate more and more near their
threshold voltage.
As a result, fluctuations of current and delay become larger.
Furthermore, even if the distribution of Vt was Gaussian, thanks to a strong
nonlinearity of delay on Vt the distribution of delay is non-Gaussian -- and
often asymmetric.
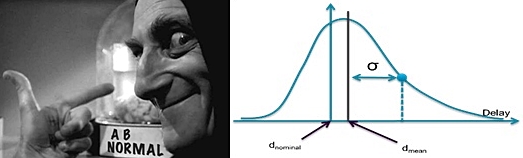
One simple quantitative measure of this asymmetry is the difference between
nominal value (say of delay) and the mean value of the distribution of delay,
as shown in the beginning of this post. We call it mean-shift. It's the
delta between D-nominal and D-mean.
It turns out that ignoring mean-shift causes significant inaccuracy in the
slack predicted by all known commercial variation-aware STA tools.
This is very dangerous for 10/7/5nm chips! Assuming that your distribution
is Gaussian and describing it by only using sigma and nominal one can see
huge error in terms of quantiles - the most meaningful accuracy metric which
correlates well to yield.
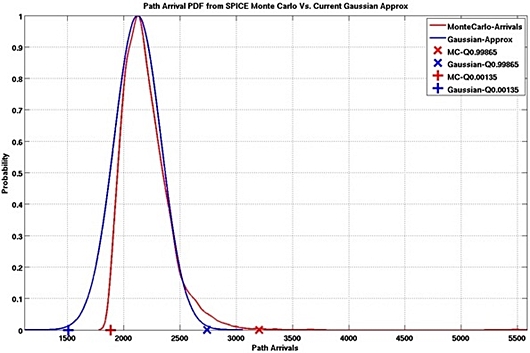
Here's distributions of arrival time of a chip path computed from MC Spice
as compared to a Gaussian distribution with same mean and std deviation.

       ----    ----    ----    ----    ----    ----    ----

My colleagues and I have developed new technology which expands the modeling
of delay variation to handle asymmetric distributions.
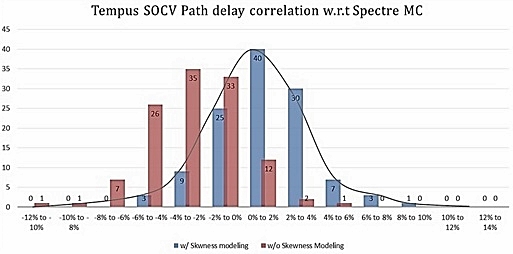
It correlates much much better to Monte Carlo SPICE.  In recent studies we
have found that the error of Tempus predictive 0.99865 quantile relative to
SPICE MC reduces by 2X when using the "skewness" of the distribution versus
when modeling delay variation as a normal Gaussian distribution.

By using additional characterization lib data (namely distribution skewness,
distribution mean, and the standard deviation of the distribution) we can
more accurately predict delays at 10/7/5nm.

More importantly we can accurately predict delays at low voltage and ultra-
low voltage operation.

John, no one in EDA has been addressing this issue until now, even though
it's been widely recognized that distributions are not always Gaussian.
I've enclosed the paper we presented on this at the Tau Workshop held in
Sonoma (Santa Rosa, CA) on March 10th.  For anyone operating at low (0.8V)
and ultra-low voltages (below 0.6V) in 10/7/5nm, this is a must read paper
to understand the potential risk in taping out their designs.

    - Igor Keller
      Cadence Design Systems, Inc.               San Jose, CA

  Editor's Note: Igor's Tau paper is #71 in DeepChip Downloads. - John
Join
Index
Next->Item
|
|